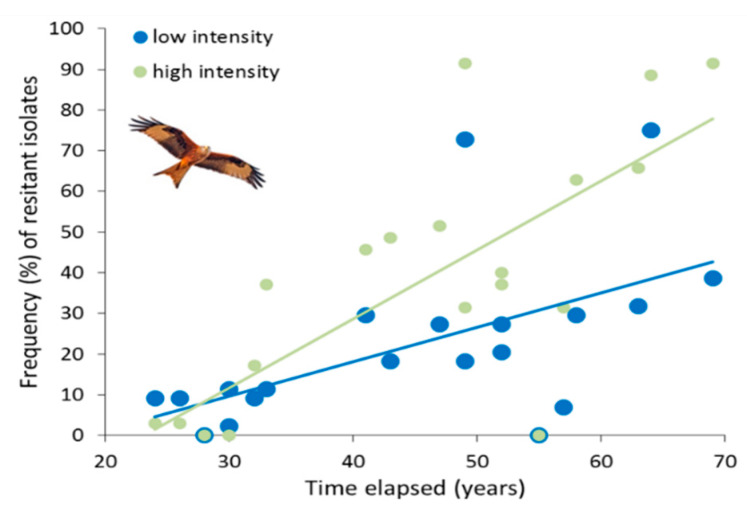
Figure 3.
Relationships between the frequency (%) of resistant E. coli isolates to each antibiotic in red kites and the time (in year) elapsed since the beginning of the commercial application of each antibiotic. Least squares regression lines of the correlations are shown for graphical representation of trends corresponding to the low- and high-intensity farming areas in Central Spain. Two pairs of overlapping data points with resistance frequency = 0 in both the low- and high-intensity areas correspond to colistin and imipenem.

