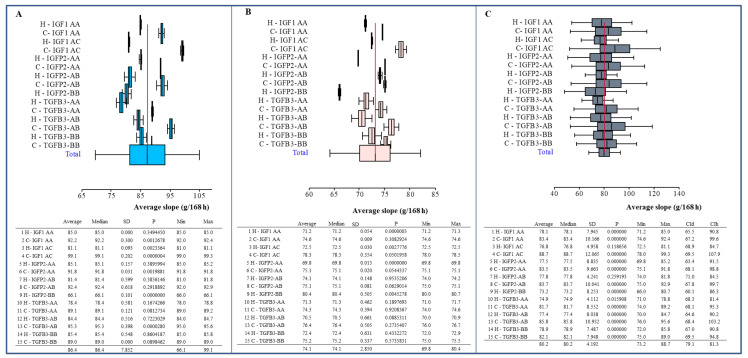
Figure 4.
Forest plot of body weight (g) of chicken (at 14–42 days of age) of both lines in individual genotypes. (A) Males; (B) females; (C) total. Statistical characteristics of individual variants: average (n), median, standard deviation (SD), p-value (compared to average value), minimum (min) and maximum (max) value. Symbol H is Hubbard F15; C is Cobb E. The line segments represent confidence interval–CI (95%).

