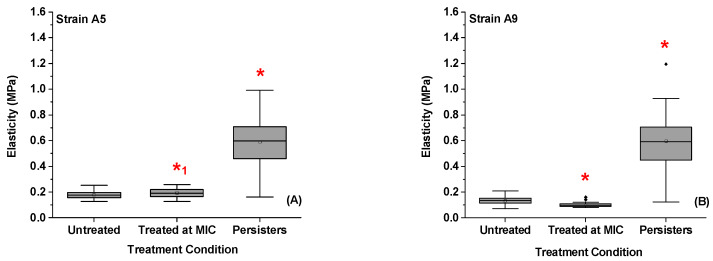
Figure 8.
(A,B) A summary of the average bacterial cell elasticities quantified for Strains A5 and A9, respectively by Hertz model described in Equation (2) for different treatments. * Values are statistically significant between the untreated and treated cells. *1 Values are statistically significant from the treated group but not from the untreated group, p < 0.001, n = 3 independent cultures.

