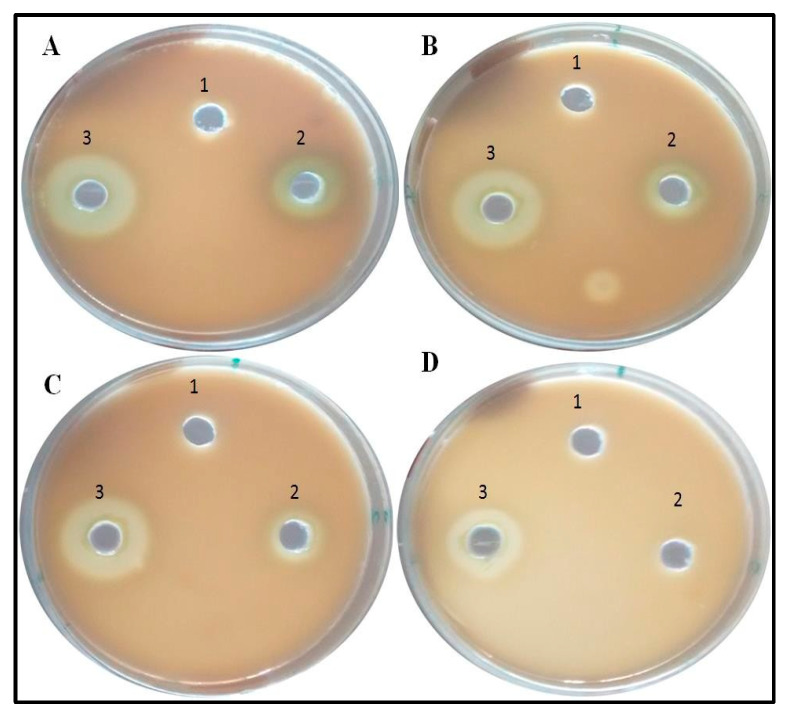
Figure 8.
Images representative of Anti-proteolytic effect of ZnO NPs. Zone size decreases as the concentration increases. Well (1) represents Nutrient Broth, well (2) PAO1 culture, and well (3) Clinical isolate. (A) Control, (B) 100 µg/mL of ZnO amended, (C) 200 µg/mL of ZnO amended, (D) 300 µg/mL of ZnO amended.

