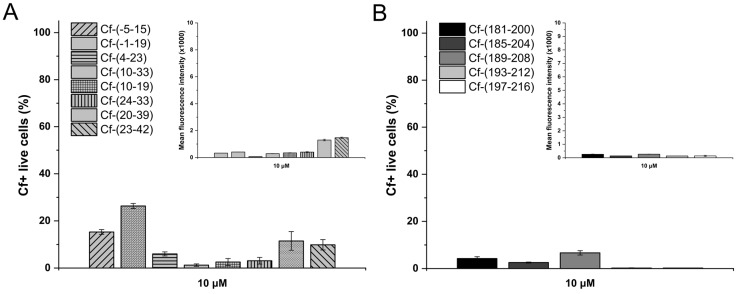
Figure 5.
Internalisation of synthetic Cf-HSV-1 gD peptides into SH-SY5Y neuroblastoma cells measured by flow cytometry. (A) Internalisation of Set I peptides at c = 10 µM, (B) internalisation of Set II peptides at c = 10 µM. Main graphs show the percentage of Cf-positive live cells, inserts show the mean fluorescence intensity. Graphs were plotted using Origin 2018 (OriginLab, Northampton, MA, USA).

