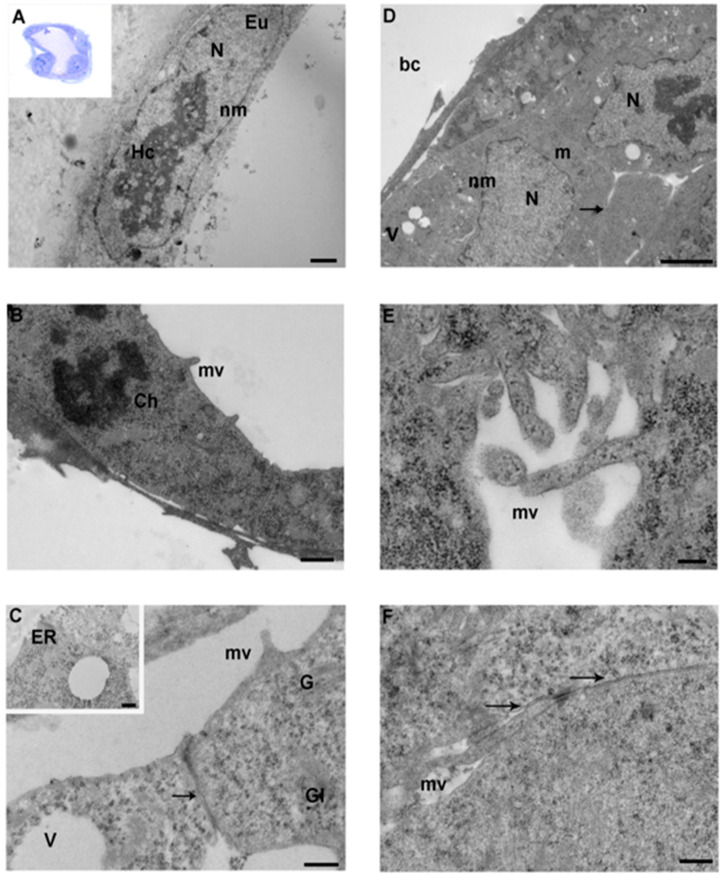
Figure 3.
Ultrastructure of a control group blastocyst. A. TEM micrograph of TE cell with a large nucleus (N). The cell showed a clear nuclear content of heterochromatin (Hc) and euchromatin (Eu) (TEM. Bar: 1 μm). Inset in A. A representative image of a semithin section of a whole blastocyst (LM. Mag: 40x). B. TE cell with evident chromosomes (Ch) (TEM. Bar: 1 μm). C. High magnification of intercellular junction (arrow) (TEM. Bar: 0.4 μm). Inset in C. Details of endoplasmic reticulum vesicle (ER) and vacuole (V). (TEM. Bar: 0.4 μm). D. Ultrastructure of ICM. Nuclei (N) show patches of heterochromatin (Hc) and euchromatin (Eu) (TEM. Bar: 2 μm). E. High magnification of microvilli (TEM. Bar: 0.2 μm). F. High magnification of intact intercellular junction (TEM. Bar: 0.4 μm). N: nucleus; Hc: heterochromatin; Eu: Euchromatin; nm: nuclear membrane; mv: microvilli; V: vacuoles; Gl: glycogen granules; arrow: intercellular contacts; bc: blastocoel cavity.

