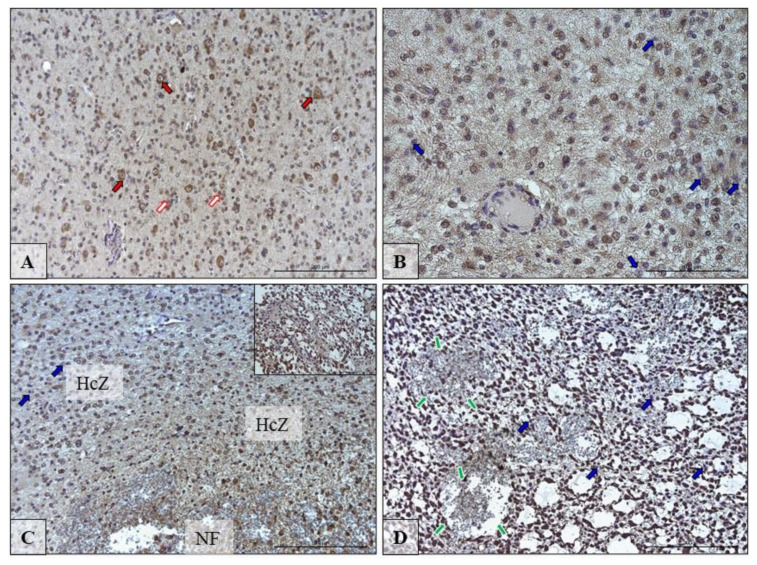
Figure 4.
Representative microphotographs showing the protein expression of desaturase SCD in neurons and glia cells in the peritumoral area (A; red and white arrows) and in cells in the growing tumor area (B; blue arrows) necrotic core (C,D; blue arrows) of brain tumors from patients diagnosed with glioblastoma. Please note that on microphotography of GTA/NC, there are many pathologically changed regions of the brain tissue that indicate brain cell necrosis envelope by hypercellular zones (HcZ), with additional microvascular hyperplasia (green arrows). There are microphotographs from different objective (obj. magnification: A,C,D ×20, B ×40); scale bar are 200 µm or 100 µm.

