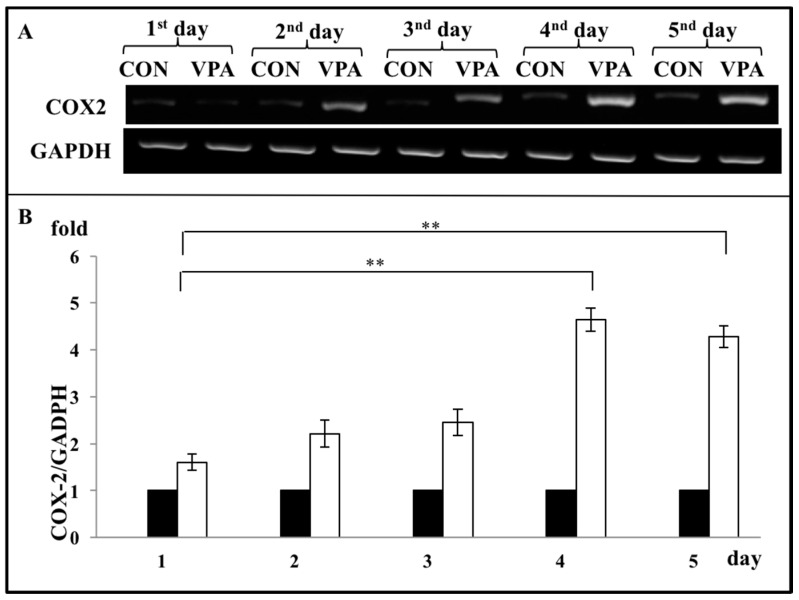
Figure 6.
Optimization for VPA treatment on the chondrocytes. Rat growth plate chondrocytes were plated for 5 groups and 60 μg/mL of VPA were daily treated in each from 1 to 5 days. After treatment, each group’s COX-2 mRNA expression levels were analyzed and compared. (A) The upper panel of the gel showed COX-2 mRNA levels in the 4 days and 5 days group significantly higher than the first day group. GADPH served as internal controls. (B) Quantitative data of expression levels of COX-2 mRNA in the experiment A. All bars represent the mean ± S.D. The black bars are CON (control, culture medium) and the white bars are VPA (valproic acid, 60 μg/mL) (n = 7, ** p < 0.01).

