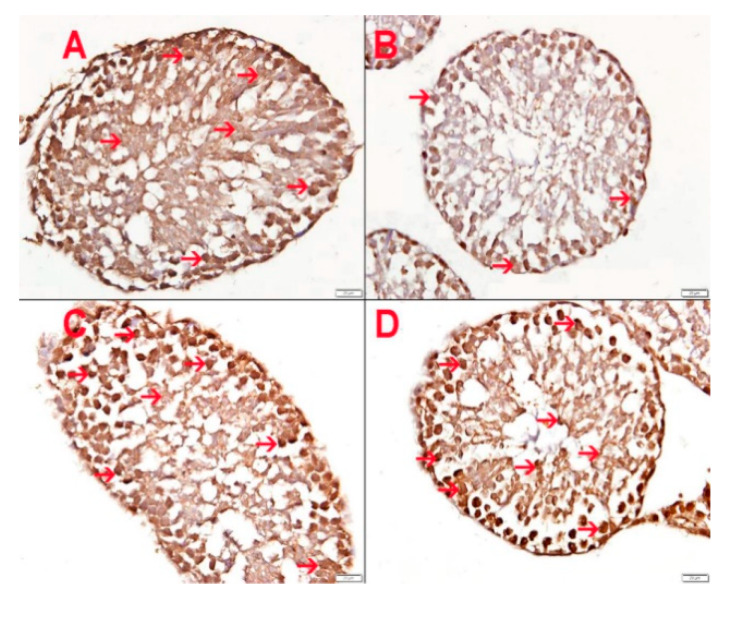
Figure 7.
Showing superoxide dismutase (SOD) expression in germ cells within seminiferous tubules. (A) Control group exposed to air showing normal expression of SOD in germ cells within the seminiferous tubules. (B) Hookah smoke (HS)-exposed group showing a lower expression of SOD by germ cells within the seminiferous tubules. (C) GA-treated group showing normal expression of SOD in germ cells within the seminiferous tubules. (D) HS-exposed group given GA showed almost normal expression of SOD by germ cells within seminiferous tubules. Scale bar in images A–D = 20 µm.

