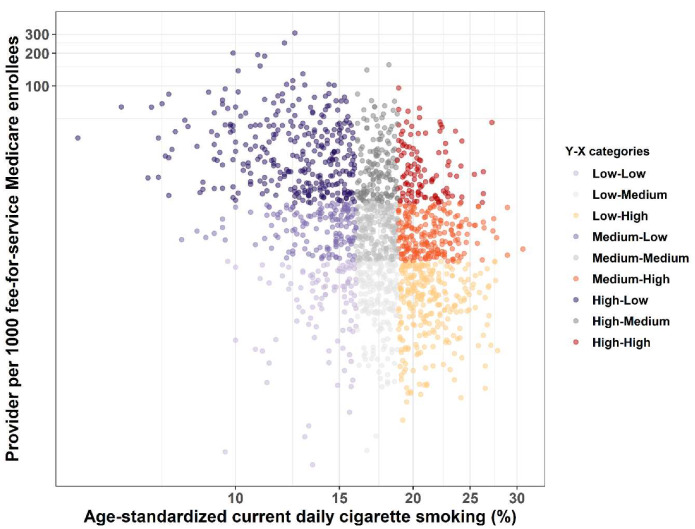
Figure 4.
Scattered plot between current daily cigarette smoking prevalence and the density of providers, who provided low-dose computed tomography (LDCT) services for lung cancer screening, per 1000 Medicare fee-for-service beneficiaries. The color scheme shows the nine combinations of the LDCT provider density and smoking prevalence patterns by tertiles: low–low, low–medium, low–high, medium–low, medium–medium, medium–high, high–low, high–medium, and high–high.

