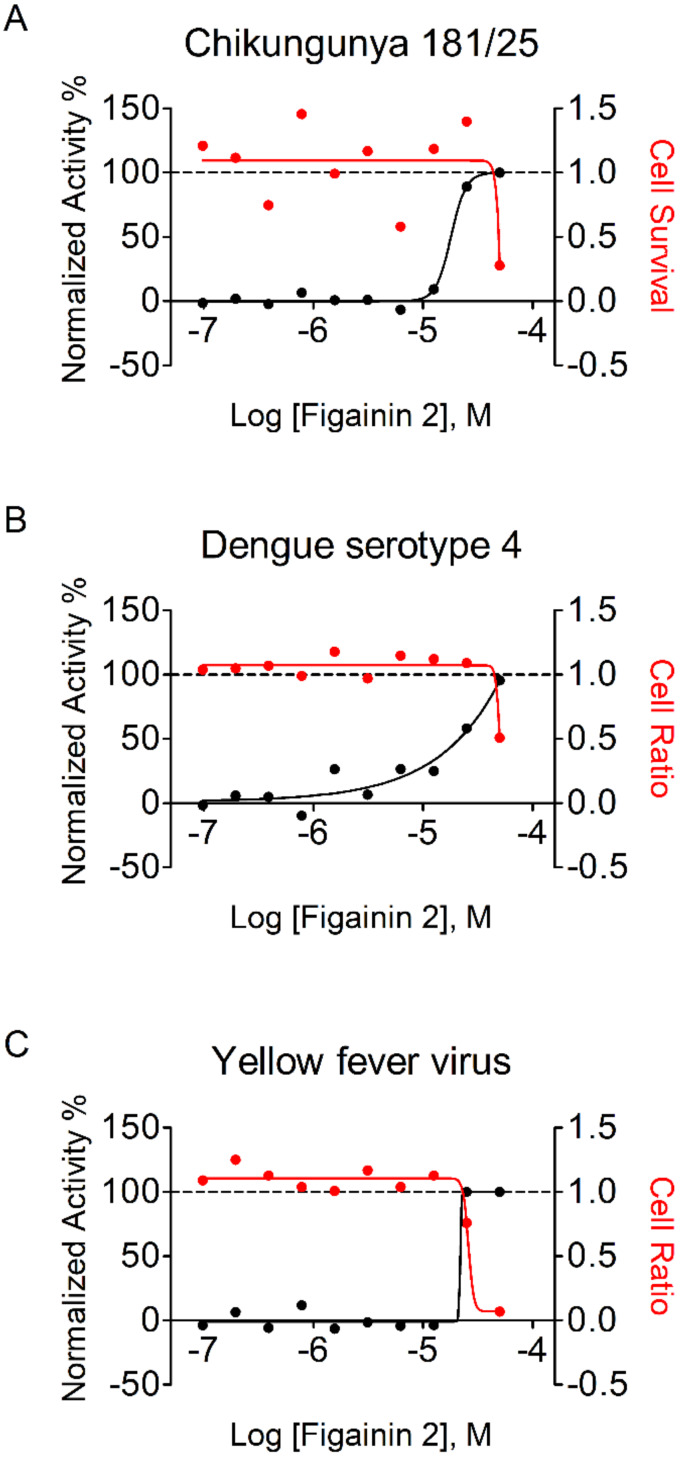
Figure 8.
Dose-response curves of Figainin 2: The X-axis indicates the log of Figainin 2 concentration (molar); the right Y-axis shows the normalized antiviral activity in percentage (in black), which represents the inhibition of infection in relation to positive control; and the right Y-axis shows the cell ratio or cell survival (in red). (A) chikungunya virus (CHIKV) 181/25, EC50 = 17.9 μM, CC50 = 49.0 μM, and SI = 2.88; (B) Dengue serotype 4 virus, EC50 = 20.8 μM, CC50 = 50.1 μM, and SI = 2.41; and (C) Yellow Fever Virus, EC50 = 21.8 μM, CC50 = 26.4 μM, and SI = 1.21.

