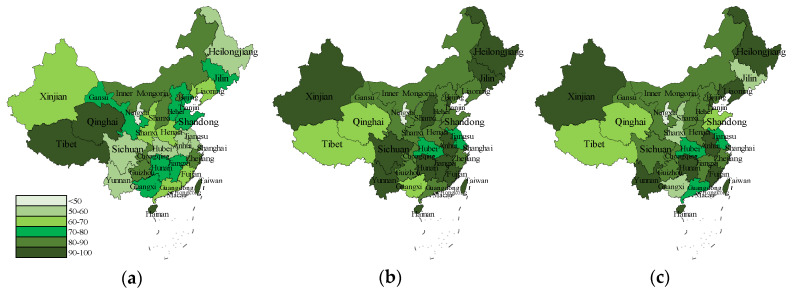
Figure 4.
Distribution of travel and willingness to participate in rural tourism. Note 1. (a) The percentage distribution of people who chose “YES” to question BEH, “Go out to rural tourism to relax in the last month”. (b) The percentage distribution of people whose average travel intention was greater than 3. The average was calculated from the terms TI1-TI3. (c) The percentage distribution of people whose average travel intention was greater than 3. The average was calculated from the terms RI1-RI3. Note 2. Measures for all items were assessed with a five-point Likert scale from “Extremely unlikely/disagree/little/unacceptable “(1) to “Extremely likely/agree/well/acceptable” (5). Note 3. The unit of data in the figure was “%”.

