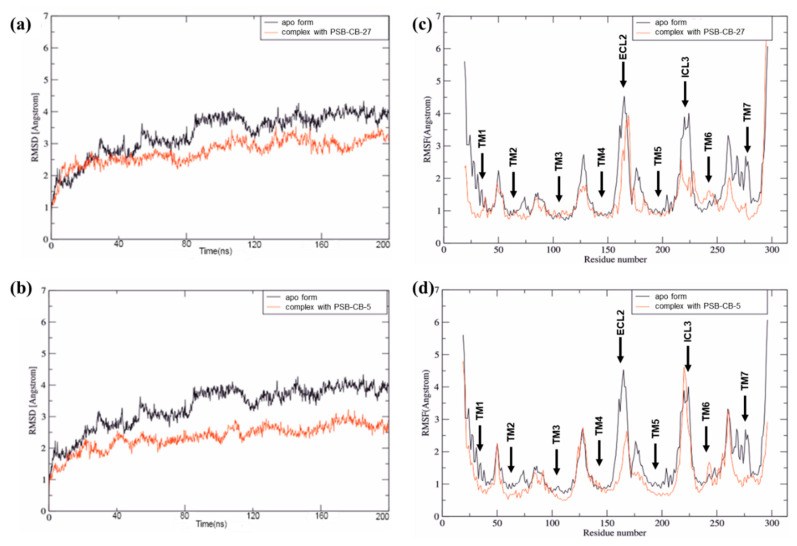
Figure 4.
(a,b) Root mean square deviation (RMSD) curves for the 200 ns MD simulation runs of the GPR18 complex with antagonist 4 (a) and antagonist 5 (b). (c,d) Root mean square fluctuation (RMSF) curves of the molecular dynamics (MD) simulation for complexes with antagonist 4 (c) and 5 (d). Curves of the complexes are colored in orange, and the curve of the apo form of the receptor in black.

