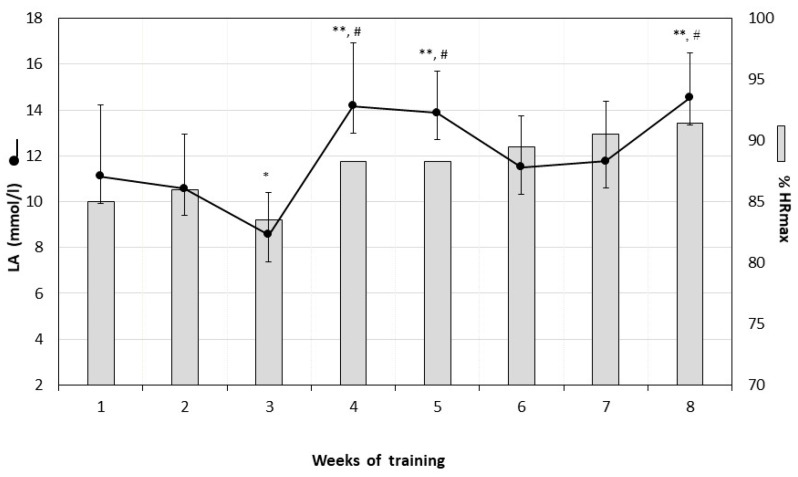
Figure 3.
Mean lactate level after two training sessions in each training week and mean % HRmax of the two training sessions in each training week. * p < 0.05 in comparison to lactate after the first; second; sixth; seventh training weeks; ** p < 0.005 in comparison to the third week; # p < 0.01 in comparison to the first; second; sixth and seventh weeks of training (Student’s t-test for dependent values). LA = lactate, HR = heart rate.

