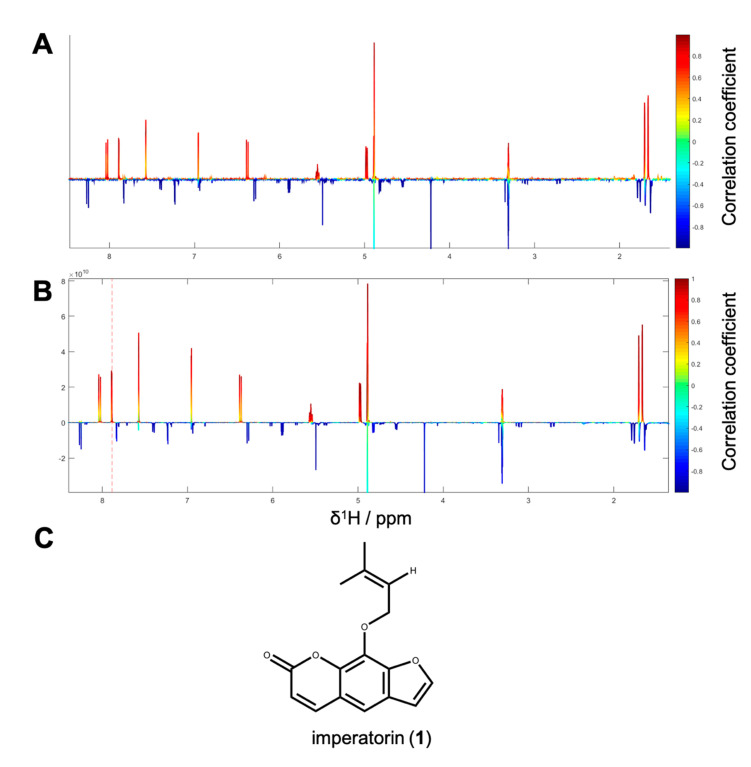
Figure 3.
(A) HetCA plot of package I. The color code is based on the correlation coefficient: red signals (“hot features”) are positive, blue signals (“cold features”) are negatively correlated with bioactivity; (B) STOCSY plot of package I. The signal at δH 7.88 was chosen to obtain the information which molecule(s) share this hot feature. The plot is color coded based on the correlation coefficient: red = signals belonging to molecule(s) that have a signal at δH 7.88; blue = signals belong to molecule(s) that do not have the signal at δH 7.88; (C) structure of the positively correlated and identified compound 1.

