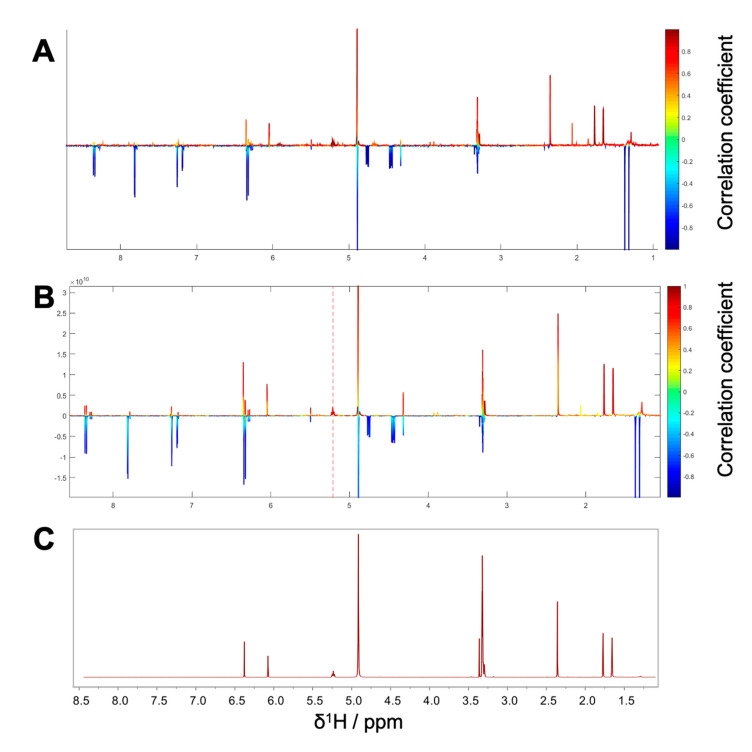
Figure 4.
Package II (A) 1H NMR pseudo-spectrum showing the HetCA of 1H NMR spectra and NF-ĸB reporter-gene inhibition data of the microfractions PO01_15–PO01_17. (B) STOCSY plot of package II. The signal at δH 5.21 was chosen to obtain the information in which molecule(s) share this hot feature. (C) 1H NMR spectra of the isolated active compound 2.

