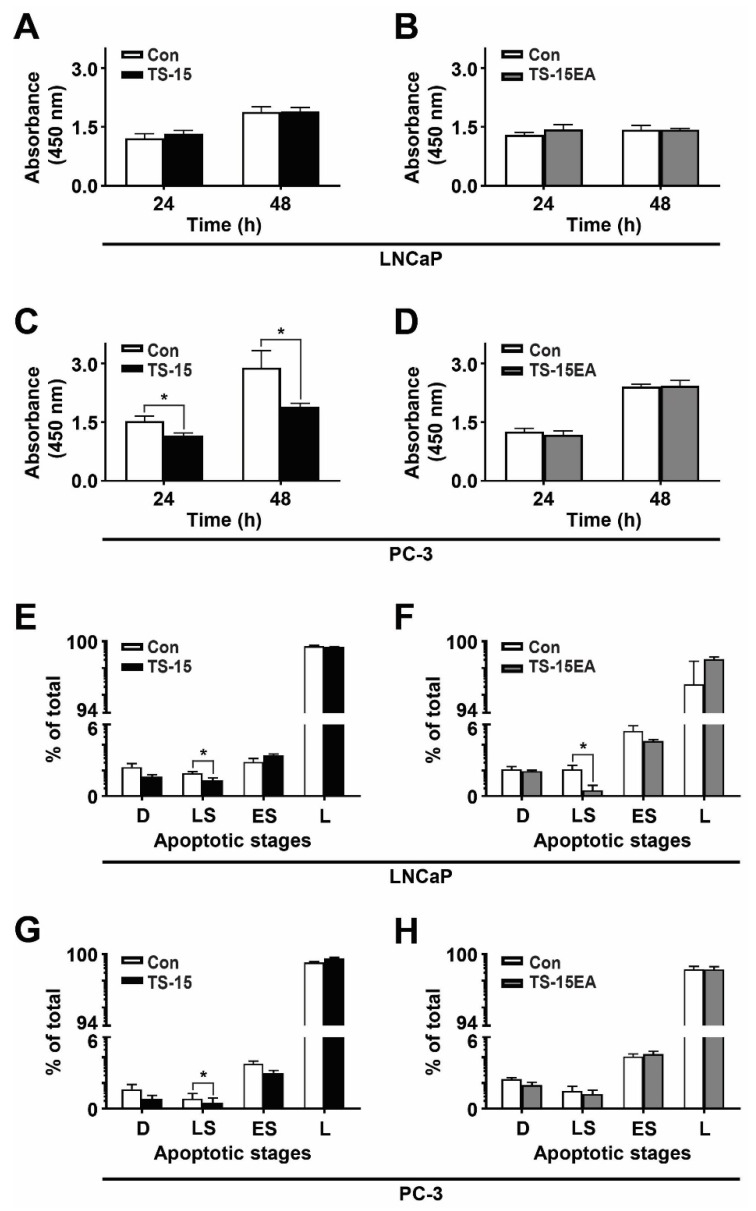
Figure 4.
Proliferation and survival analysis of ADAMTS-15 and ADAMTS-15EA transfectants. (A–D) Relative proliferation of LNCaP cells expressing ADAMTS-15 (A) or ADAMTS-15EA (B), and PC-3 cells expressing ADAMTS-15 (TS-15) (C) or ADAMTS-15EA (TS-15EA) (D) in comparison to pcDNA3.1 controls (Con) at the times indicated using the WST-1 method and measuring absorbance at 450 nm (* p < 0.05; n = 3 pcDNA3.1, n = 4 ADAMTS-15 and ADAMTS-15EA). (E–H) Relative survival of LNCaP cells expressing ADAMTS-15 (TS-15) (E) or ADAMTS15EA (TS-15EA) (F), and PC-3 cells expressing ADAMTS-15 (G) or ADAMTS-15EA (H) compared to respective pcDNA3.1 controls (Con). Apoptosis was quantified by staining with FITC and PI and assessing cells in the four quadrants: D = dead cells, LS = late stage apoptosis, ES = early stage apoptosis, L = live cells (* p < 0.05; n = 3 pcDNA3, n = 4 ADAMTS-15 and ADAMTS-15EA).

