Figure 6.
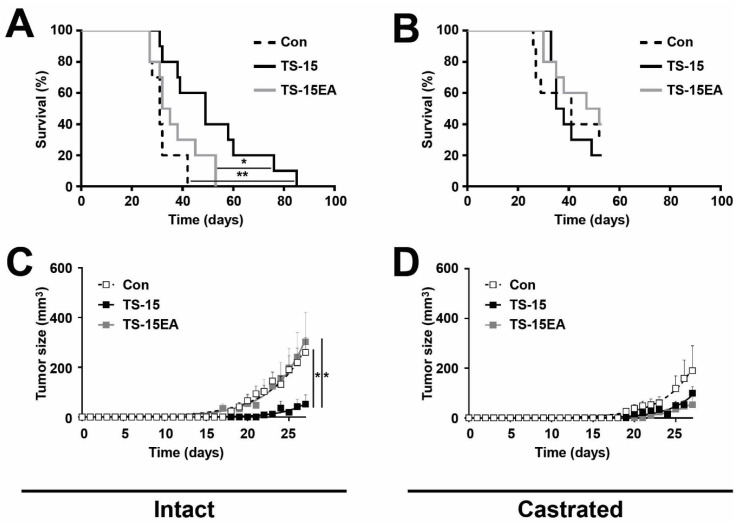
Tumorigenicity of androgen-responsive LNCaP xenografts in NOD/SCID mice. (A,B) Kaplan-Meier survival curves for intact (A) and castrated (B) male mice bearing LNCaP tumors expressing ADAMTS-15 (TS-15) or ADAMTS-15EA (TS-15EA) or pcDNA3.1 containing controls (Con), as indicated. Individual mice are shown, with statistical significance provided (* p < 0.05, ** p < 0.01 within mouse cohorts #p < 0.01 between mouse cohorts; log-rank Mantel-Cox test; n = 10 for intact, and n = 5–8 for castrated). (C,D) Growth of LNCaP tumors in intact (C) and castrated (D) mice from panels A and B, expressed as tumor size as estimated from external caliper measurements. These are shown as mean ± S.E.M. across all mice in each cohort, with statistical significance provided (* p < 0.05; Student’s t test; n = 10).

