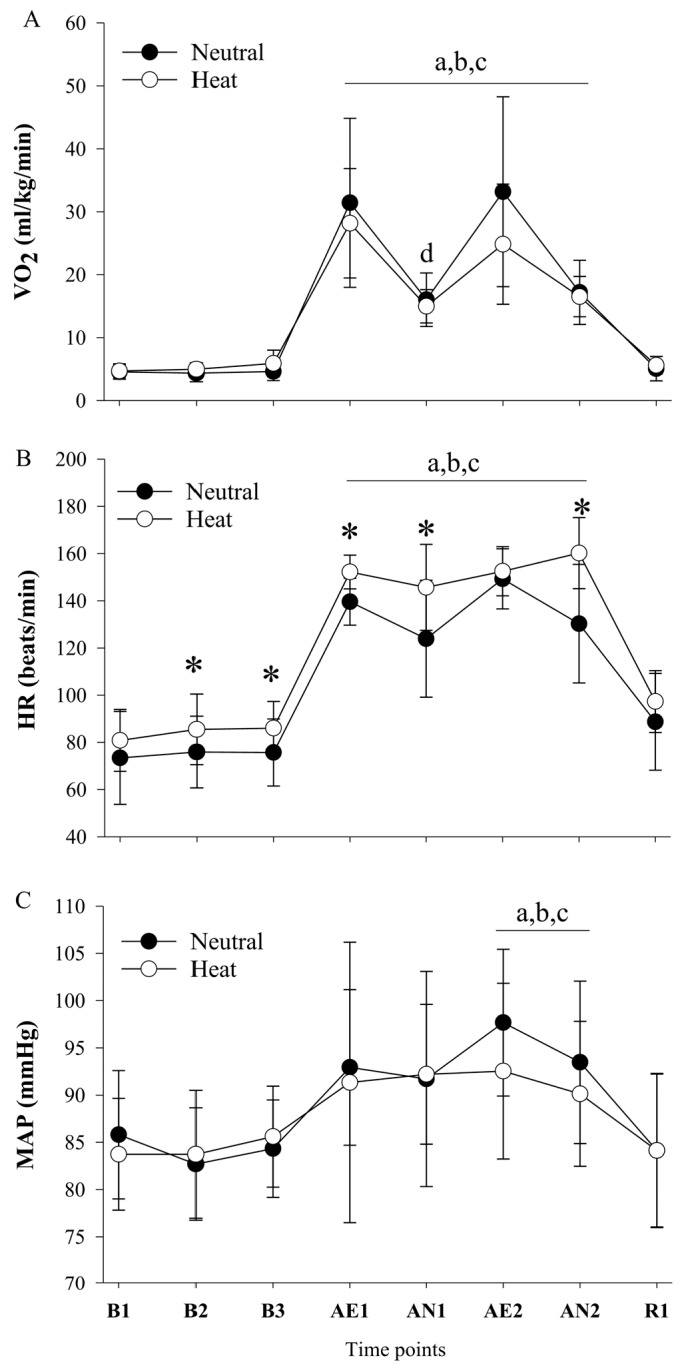
Figure 3.

(A) Oxygen uptake (B) heart rate, and (C) mean arterial pressure response in thermoneutral and heat conditions. B1, baseline; B2, second baseline; B3, third baseline, AE1, first walking; AN1, first lifting; AE2; second walking; AN2, second lifting; R1, recovery. Values are mean ± standard deviation (n = 10). a p ≤ 0.05 versus B1; b p ≤ 0.05 versus B2; c p ≤ 0.05 versus B3; d p ≤ 0.05 versus AE1; * p ≤ 0.05 versus heat condition.
