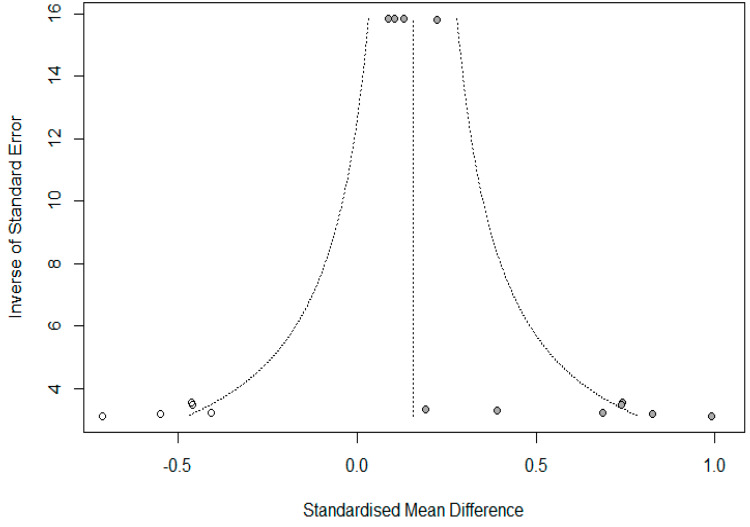
Figure 3.
A funnel plot to assess potential publication bias. Measures of effect size (standardized mean differences) are represented on the x-axis and for study precision (the inverse of standard error) on the y-axis. The gray and white circles represent observed data (11 comparisons) and added data (5 studies), respectively.

