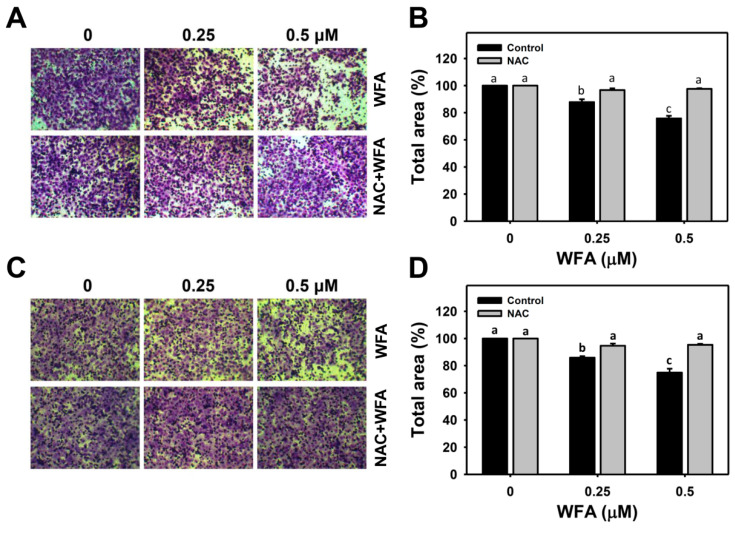
Figure 4.
Three-dimensional anti-migration and -invasion effects of low concentrations of WFA in oral cancer cells. (A,C) 3D migration and invasion images of Ca9-22 cells after NAC and/or WFA treatments. Cells were pretreated with or without NAC (2 mM, 1 h) and post-treated with different concentrations of WFA for 21 h. (B,D) Statistics of 3D migration and invasion changes in Figure 4A,B. For multiple comparison, treatments without the same labels (a–c) indicate the significant difference. p < 0.001~0.0001 (B) and p < 0.01~0.001 (D). Data, mean ± SD (n = 3).

