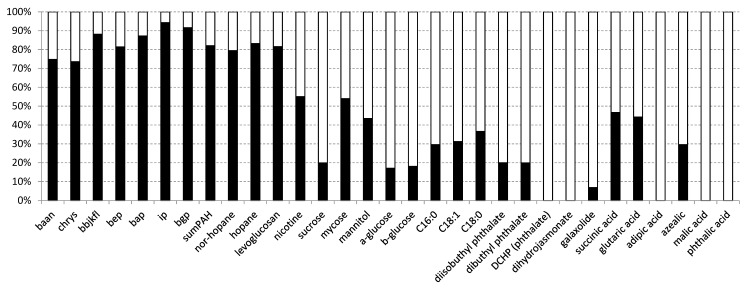
Figure 3.
Relative component loadings (%) obtained from multivariate curve resolution-alternating least squares of the organic molecular tracer compounds in PM2.5 aerosols from the schools shown in Figure 1 that represent the indoor (white bars) and outdoor (black bars) organic aerosol (OA). The abbreviations in the abscissas axis are indicated in Table 1.

