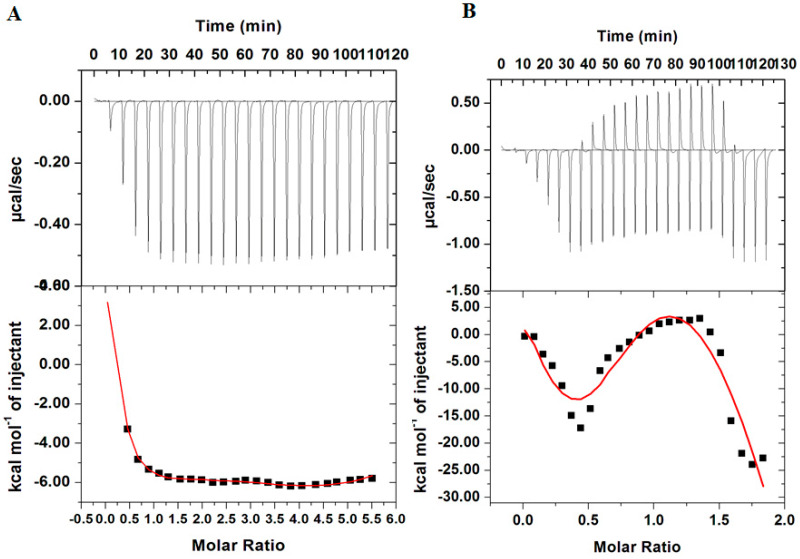
Figure 5.
(A) Isothermal titration calorimetric profile obtained upon titration of 100 µM DP into 20 µM MARK4. (B) Isothermal titration calorimetric profile obtained upon titration of 200 µM RT into 20 µM MARK4. The bottom panel shows resultant binding isotherm before the integration of peak area and normalization to yield a plot of molar enthalpy change against the ligand/protein ratio.

