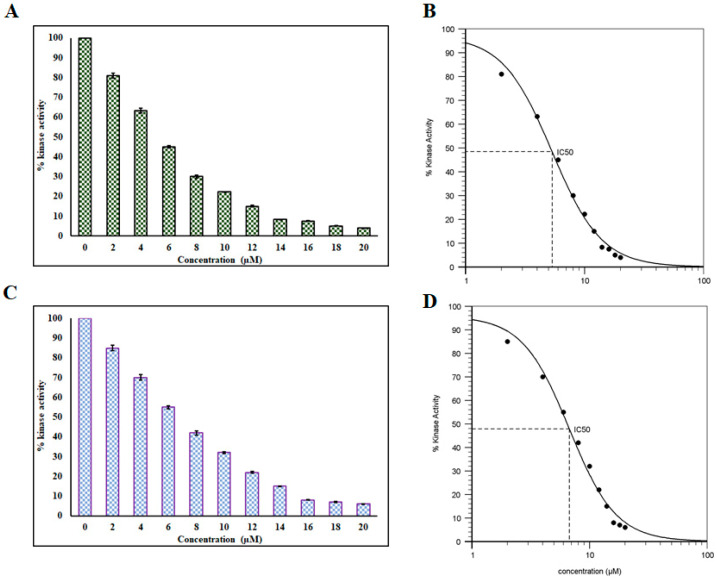
Figure 6.
(A) ATPase assay showing the effect of DP on the kinase activity of MARK4. (B) IC50 plot of DP obtained through the AAT Bioquest calculator [67]. (C) ATPase assay depicting the effect of RT on the kinase activity of MARK4. (D) IC50 plot of RT obtained through the AAT Bioquest calculator [67].

