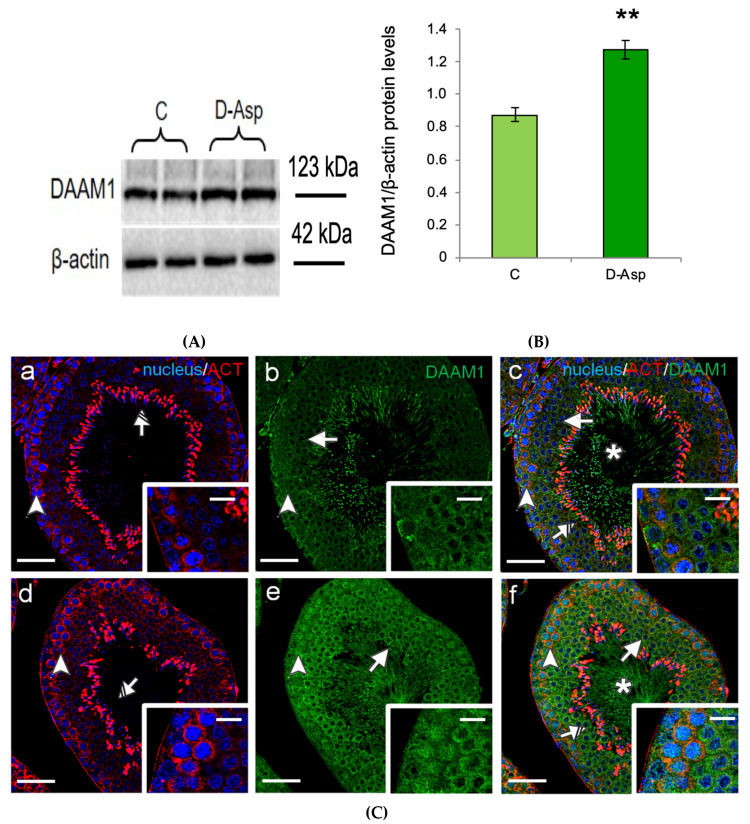
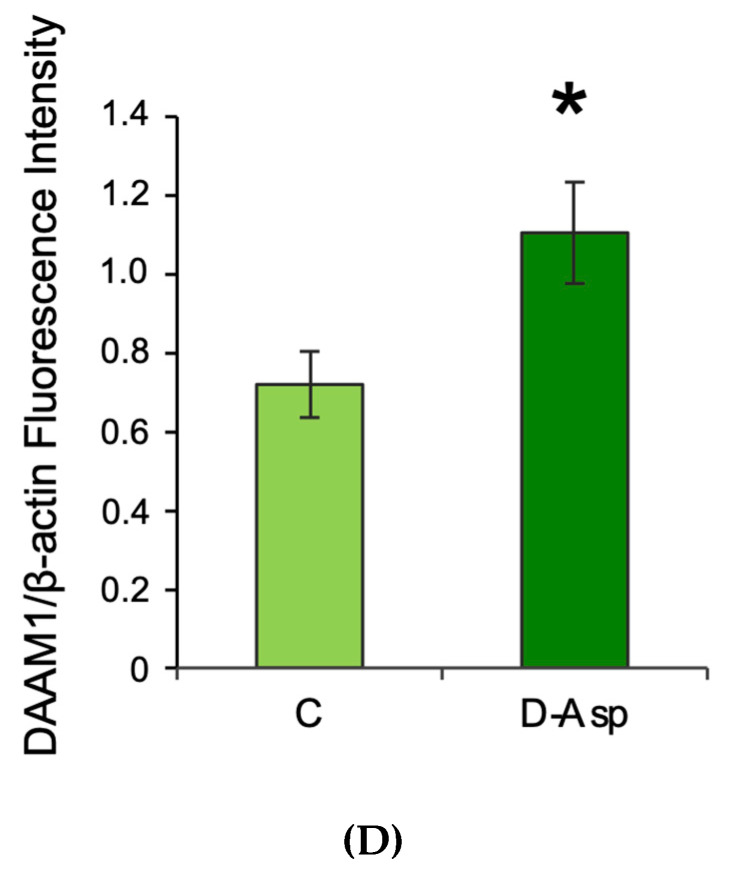
Figure 1.
Testicular Disheveled-Associated-Activator of Morphogenesis1 (DAAM1) protein levels and localization in D-Asp treated rats. (A) Western blot analysis of DAAM1 (123 kDa) protein levels in the testis from D-Asp-treated and control rats. (B) The amount of DAAM1 was quantified using ImageJ program and normalized with respect to β-actin (42 kDa). Values represent the means ± S.D. of five samples. ** p < 0.01 versus controls. (C) DAAM1 and actin co-localization in the testis from controls (a–c) and D-Asp-treated rats (d–f). (a,d) DAPI-fluorescent nuclear staining (blue) and β-actin (ACT) localization (red). (b,e) DAAM1 fluorescence (green). (c,f) Merged fluorescent channels (blue/red/green). The intermediate yellow-orange and light-blue tints reflect DAAM1 co-localization with β-actin within the cytoplasm and in the nucleus, respectively. The images in the insets were captured at ×40 magnification, all the others at ×20 magnification. Scale bars represent 20 μm, except for the insets, where they represent 10 μm. Arrowheads: Spermatogonia; Arrows: Spermatocytes. Striped Arrows: Spermatids; Asterisks: luminal Spermatozoa. (D) Histogram showing the quantification of DAAM1 fluorescence signal intensity whit respect to β-actin signal using ImageJ. Values represent the means ± S.D. of three separate experiments. * p < 0.05 versus controls.


