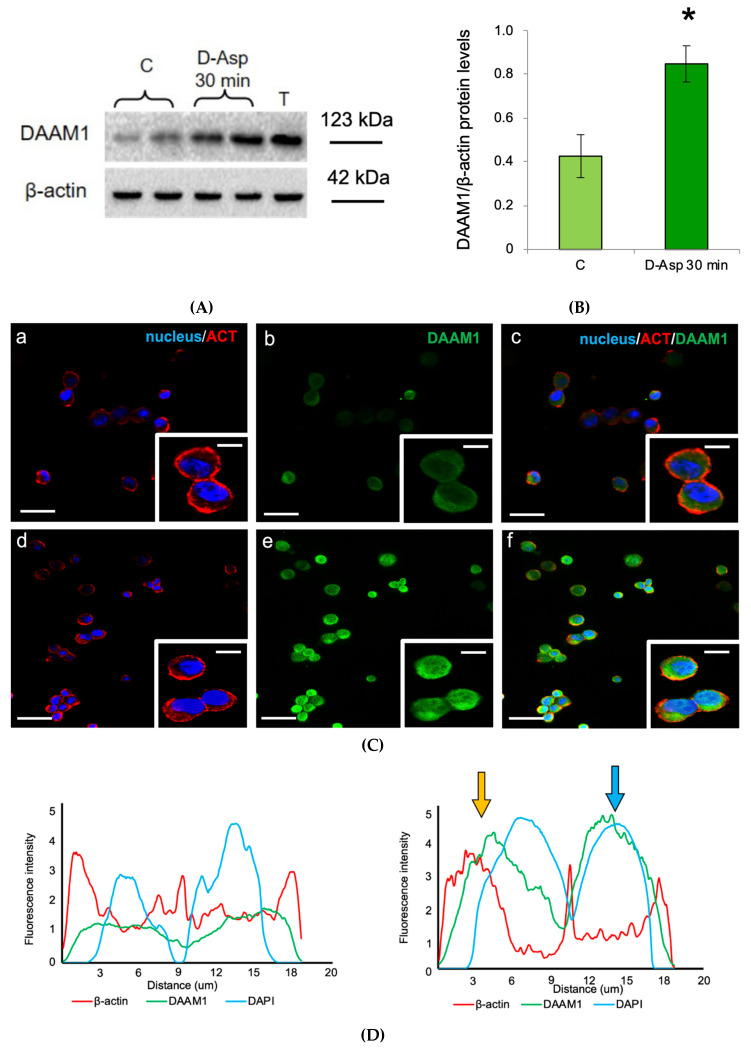
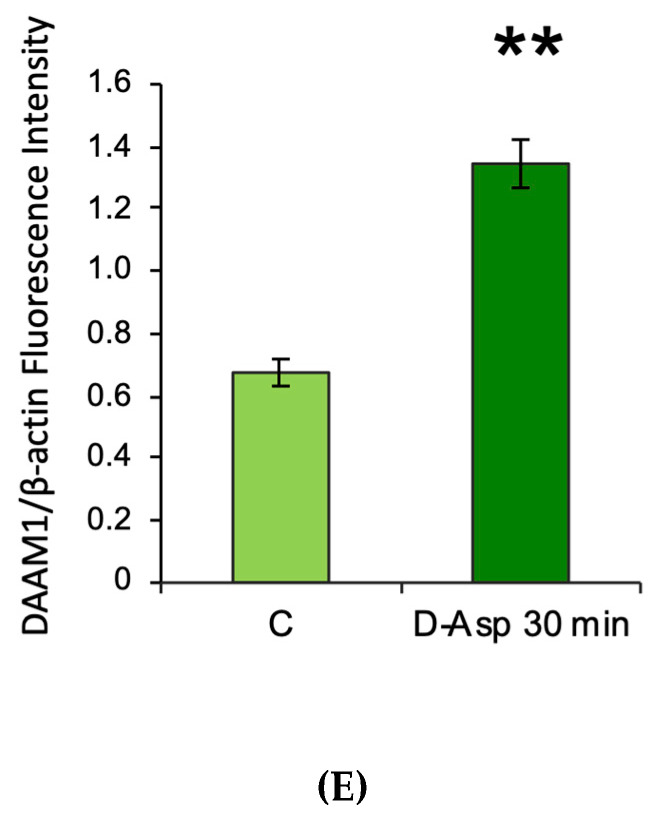
Figure 4.
DAAM1 protein levels and localization in cultured mouse GC-1 cells. (A) DAAM1 Western blot detection (123 kDa) in GC-1 cells at 30 min after D-Asp treatment and at time 0 (control, C); T = Testis. (B) DAAM1 protein levels are quantified using the ImageJ program and normalized with respect to β-actin (42 kDa). Values represent the means ± S.D. of three separate experiments. * p < 0.05 versus controls. (C) DAAM1 and β-actin co-localization in controls (a–c) and insets) and in D-Asp treated mouse GC-1 cultured cells (d–f) and insets). (a,d) DAPI-fluorescent nuclear staining (blue) and β-actin (ACT) localization (red). (b,e) DAAM1 fluorescence (green). (c,f) merged fluorescent channels (blue/red/green). The intermediate yellow-orange and light-blue tints reflect DAAM1 co-localization with β-actin and in the nucleus, respectively. The images of the magnifications were captured at ×40 magnification, all the others at ×20 magnification. Scale bars represent 20 μm, except for the magnifications, where they represent 10 μm. (D) Plot profiles of normalized pixel intensity of DAAM1 (green), β-actin (red) and DAPI (blue) corresponding to the GC-1 cells highlighted in the insets. Analysis of colocalization of β-actin (red curves) and DAPI (blue curves) with DAAM1 (green curve) in control (on the left) and D-Asp treated GC-1 cells. The fluorescence intensity profiles show the distribution of fluorescence across the dotted line (x-axis). The fluorescence intensities are plotted along the y-axis. Arrows indicate DAAM1-β-actin (yellow) and DAAM1-DAPI (light blue) co-localization. (E) Histogram showing the quantification of DAAM1 fluorescence signal intensity with respect to β-actin using ImageJ. Values represent the means ± S.D. of three separate experiments. ** p < 0.01 versus controls.


