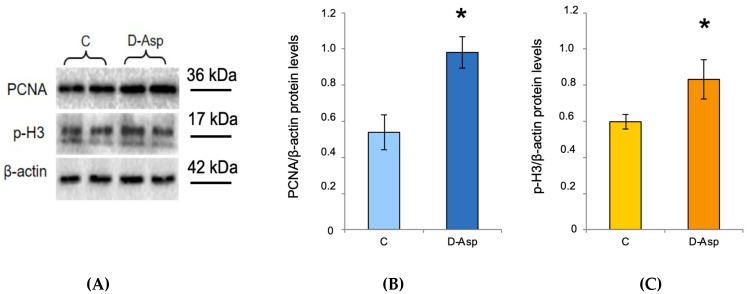
Figure 5.
Testicular PCNA and p-H3 protein levels in D-Asp treated rats. (A) Western blot analysis of PCNA (36 kDa) and p-H3 (17 kDa) proteins in the testis from D-Asp-treated rats and controls. (B) The amount of PCNA was quantified using ImageJ program and normalized with respect to β-actin (42 kDa). Values represent the means ± S.D. of five samples. * p < 0.05 versus controls. (C) The amount of p-H3 was quantified using the ImageJ program and normalized with respect to β-actin. Values represent the means ± S.D. of five samples. * p < 0.05 versus controls.

