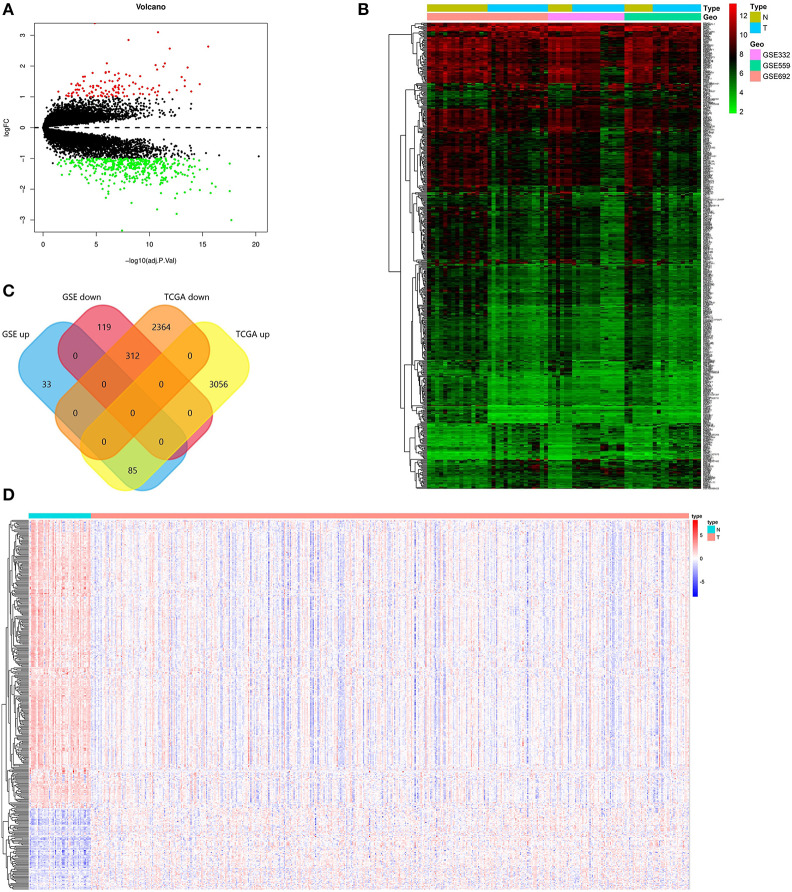
Figure 1.
Identification of the DEGs. (A) Volcano plot of the integrated microarray of GSE69223, GSE3325, and GSE55945. The red nodes represent up-regulated DEGs. The green node indicates down-regulated DEGs. (B) A heatmap of all DEGs of the integrated microarray. Each column represents one dataset and each row represents one gene. The color changing from green to red represents the changing from downregulation to upregulation for the expression. (C) Venn diagrams of the overlapping DEGs between the integrated three microarrays and the TCGA PRAD dataset. (D) A heatmap of the overlapping DEGs in the TCGA PRAD dataset.

