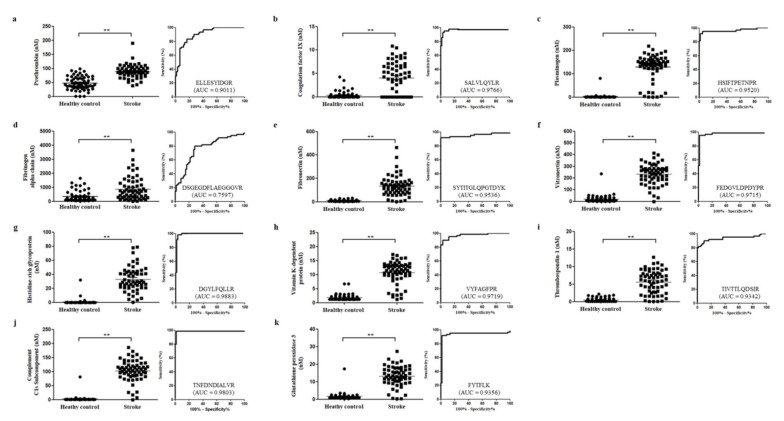
Figure 3.
Scatter plots and ROC curves. The figures show dot plots and ROC curves of 11 candidate proteins in comparison with ischemic stroke and healthy control as MRM verification results. (a) prothrombin, (b) coagulation factor, (c) plasminogen, (d) fibrinogen alpha chain, (e) fibronectin, (f) vitronectin, (g) histidine-rich glycoprotein, (h) vitamin K-dependent protein, (i) thrombospondin 1, (j) complement C1s subcomponent, (k) glutathione peroxidase 3. An ROC curve is a plot of sensitivity on the y-axis against (100−specificity)% on the x-axis at all possible cut-points. AUC value was shown inside the ROC curves with sensitivity and specificity. ** p <0.01.

