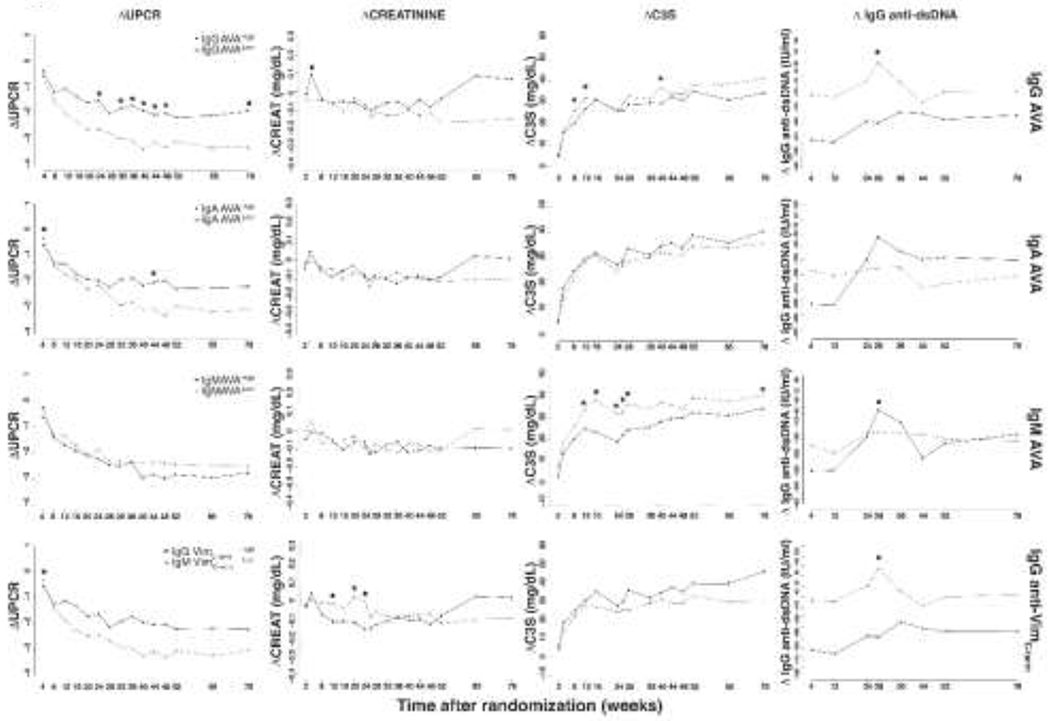
Figure 4.

Disease activity changes (Δ) from baseline in LUNAR patients with high or low AVA titres. For each AVA subtype (sparated by row, labelled on the right hand side), all patients (both treatment regimens combined) were divided into AVA high (above median baseline AVA subtype titre) or AVA low (below median baseline AVA subtype titre) groups. ANOVA tests were performed between groups at each time point, and where significant indicated. 0.01<* p <0.05. UPCR=Urine protein/serum creatinine ratio; CREAT=serum creatinine; C3S=soluble complement factor C3. For each row, legends in the left most graph indicate the serological stratification of LUNAR patients.
