
Figure 1: Loss of Myt TFs reduces functional β-cell mass.
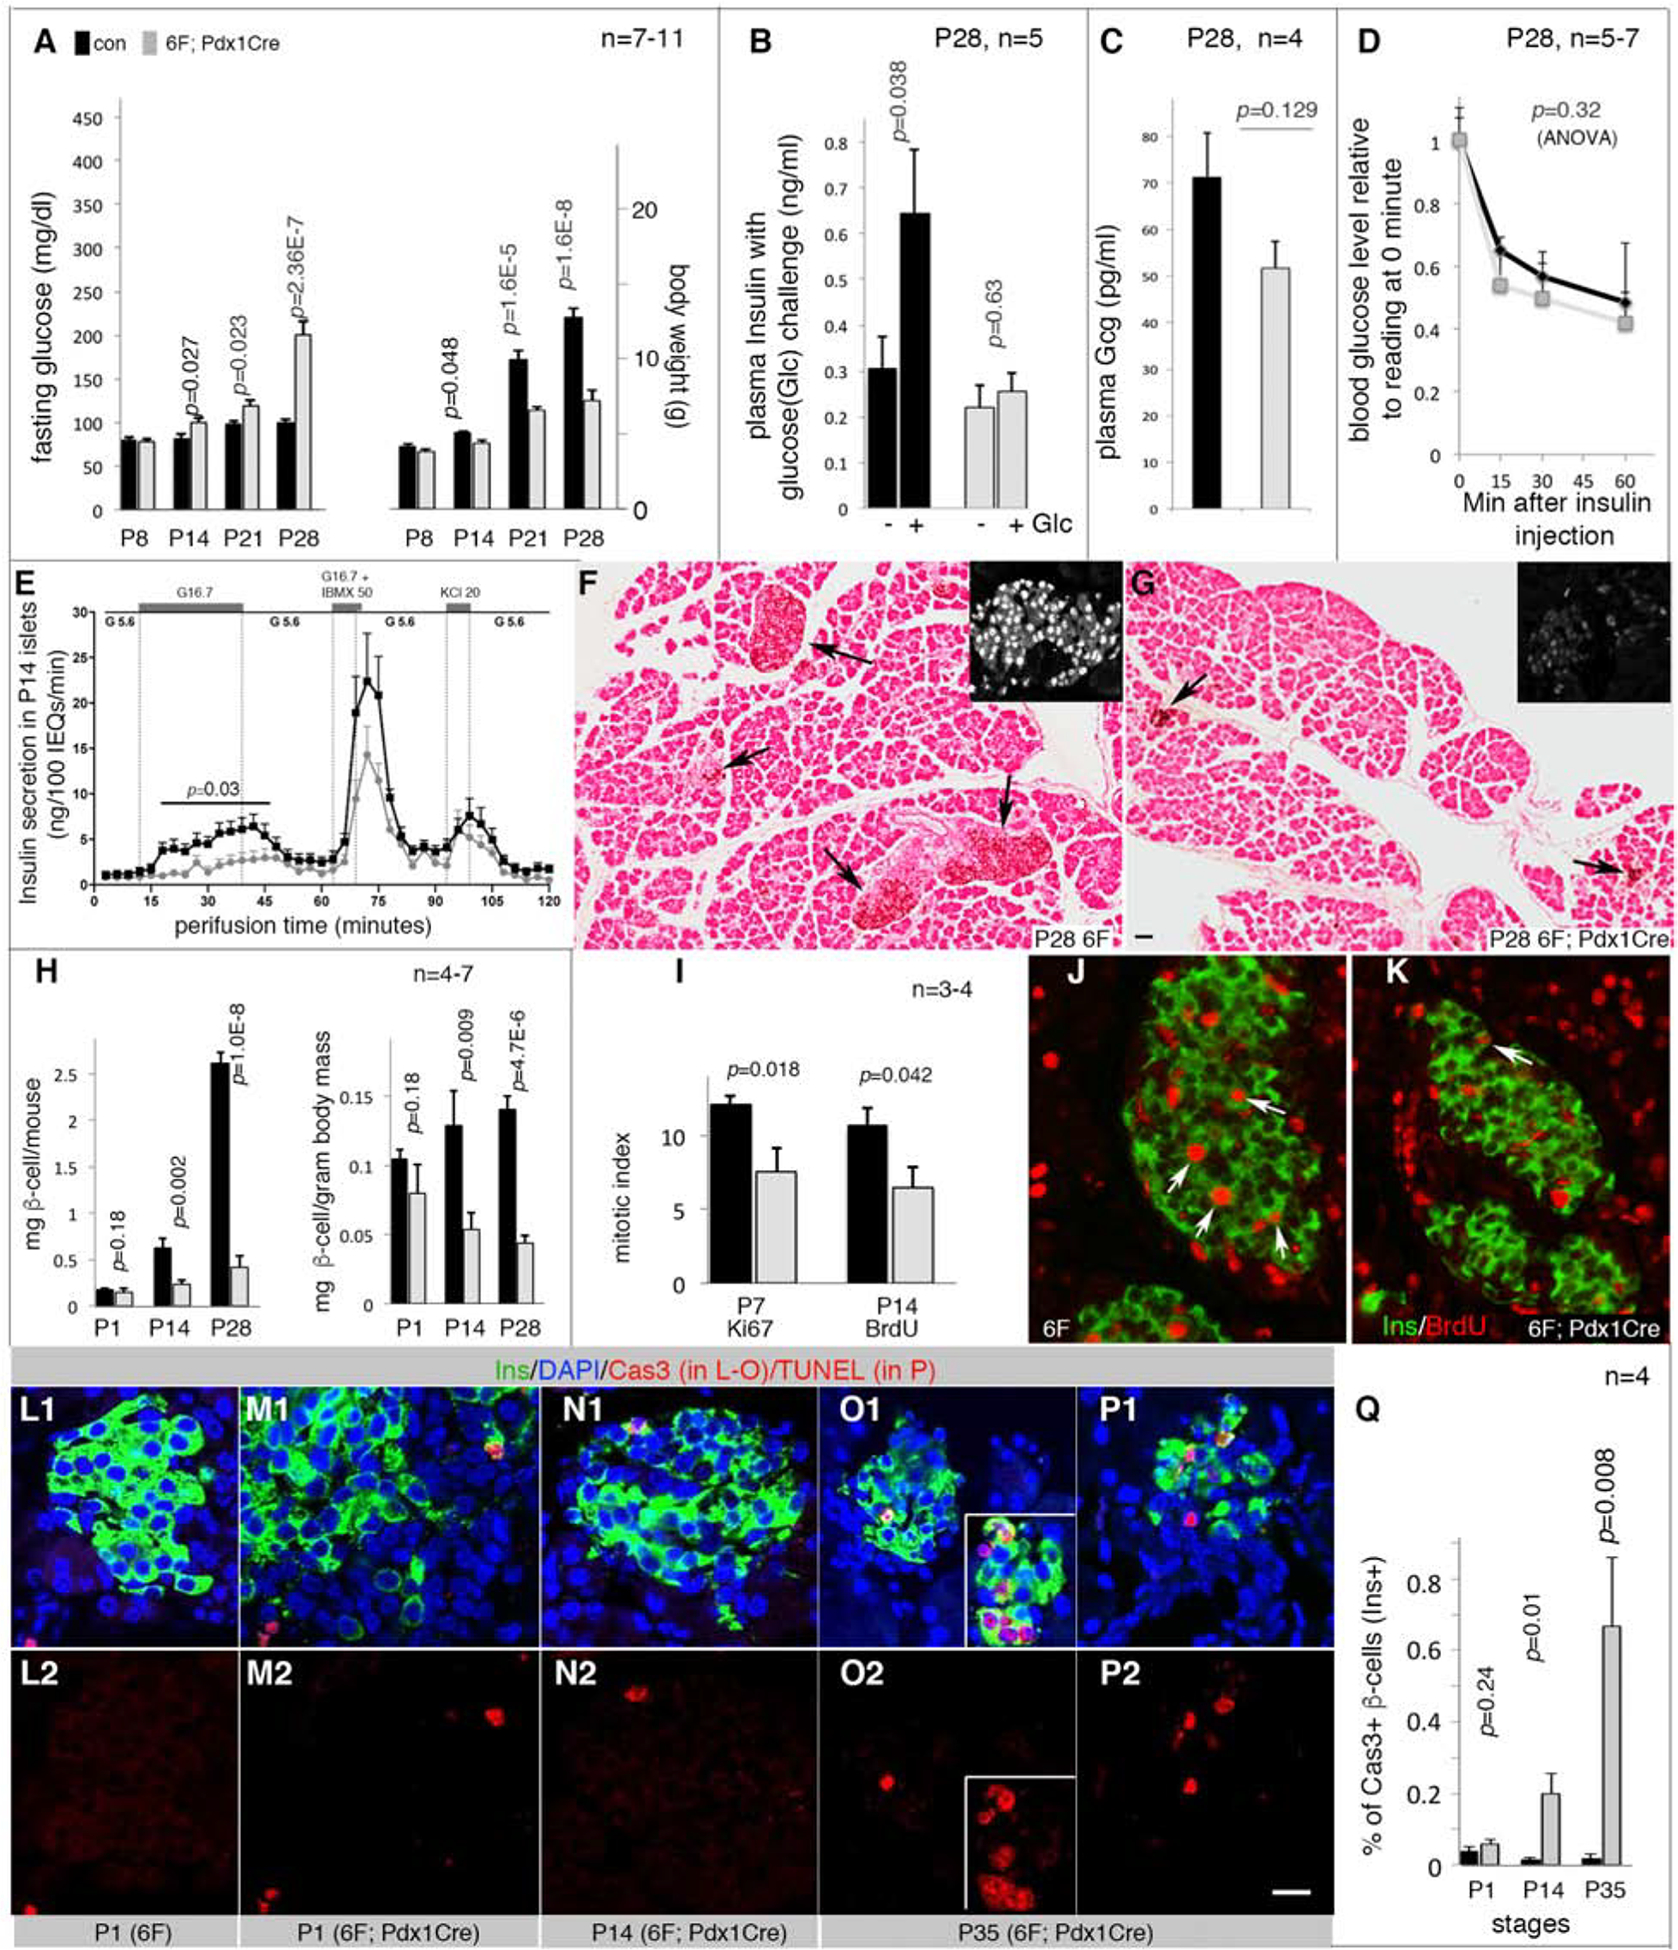
Also see Figure S1 and Table S1. The p-values were type 2, 2-tailed t-test except in D and E (ANOVA). Error bars in all quantification panels, SEM. “n”, the number of mice used. Black bars or lines, controls. Grey bars or lines, mutants.
(A) Glycemic phenotypes (left) and body weight (right). Controls include wild type, Pdx1Cre, and 6F mice.
(B) Plasma insulin before and 30 minutes after glucose challenge.
(C) Plasma glucagon (Gcg) levels in mice fasted overnight.
(D) Insulin tolerance tests. p, one-way ANOVA.
(E) Insulin-secretion assays via perifusion with sequential inductions by: G5.6 (5.6 mM glucose), G16.7, G5.6, G16.7 + 50 μM IBMX (a cyclase inhibitor to increase intracellular cAMP levels), G5.6+KCl (20 mM), and G5.6. p value is from one-way ANOVA, calculated between control/mutant samples stimulated by G16.7.
(F, G) Insulin detection with horse-radish peroxidase (HRP)-staining to visualize insulin+ cells (black arrows). Scale bar = 50 μm. Insets, examples of islet stained for Pdx1, showing islet morphology.
(H) β-cell mass, mg β-cells per mouse or mg β-cells per gram of body weight.
(I-K) Mitotic indices (I) assayed with Ki67 expression (P7. I) or BrdU incorporation (P14, with 2-day BrdU feeding. J, K.). Arrows, mitotic cells.
(L-Q) β-cells with activated Caspase 3 (Cas3, L-O) or TUNEL signals (P). The two rows are merged (top) and single (bottom) channels. Insets in O2 showed a cluster of Cas3+ β-cells. In P2, scale bar = 20 μm, applicable to J-P.