
Figure 2. Myt TFs are required for sustained expression of several β-cell markers.
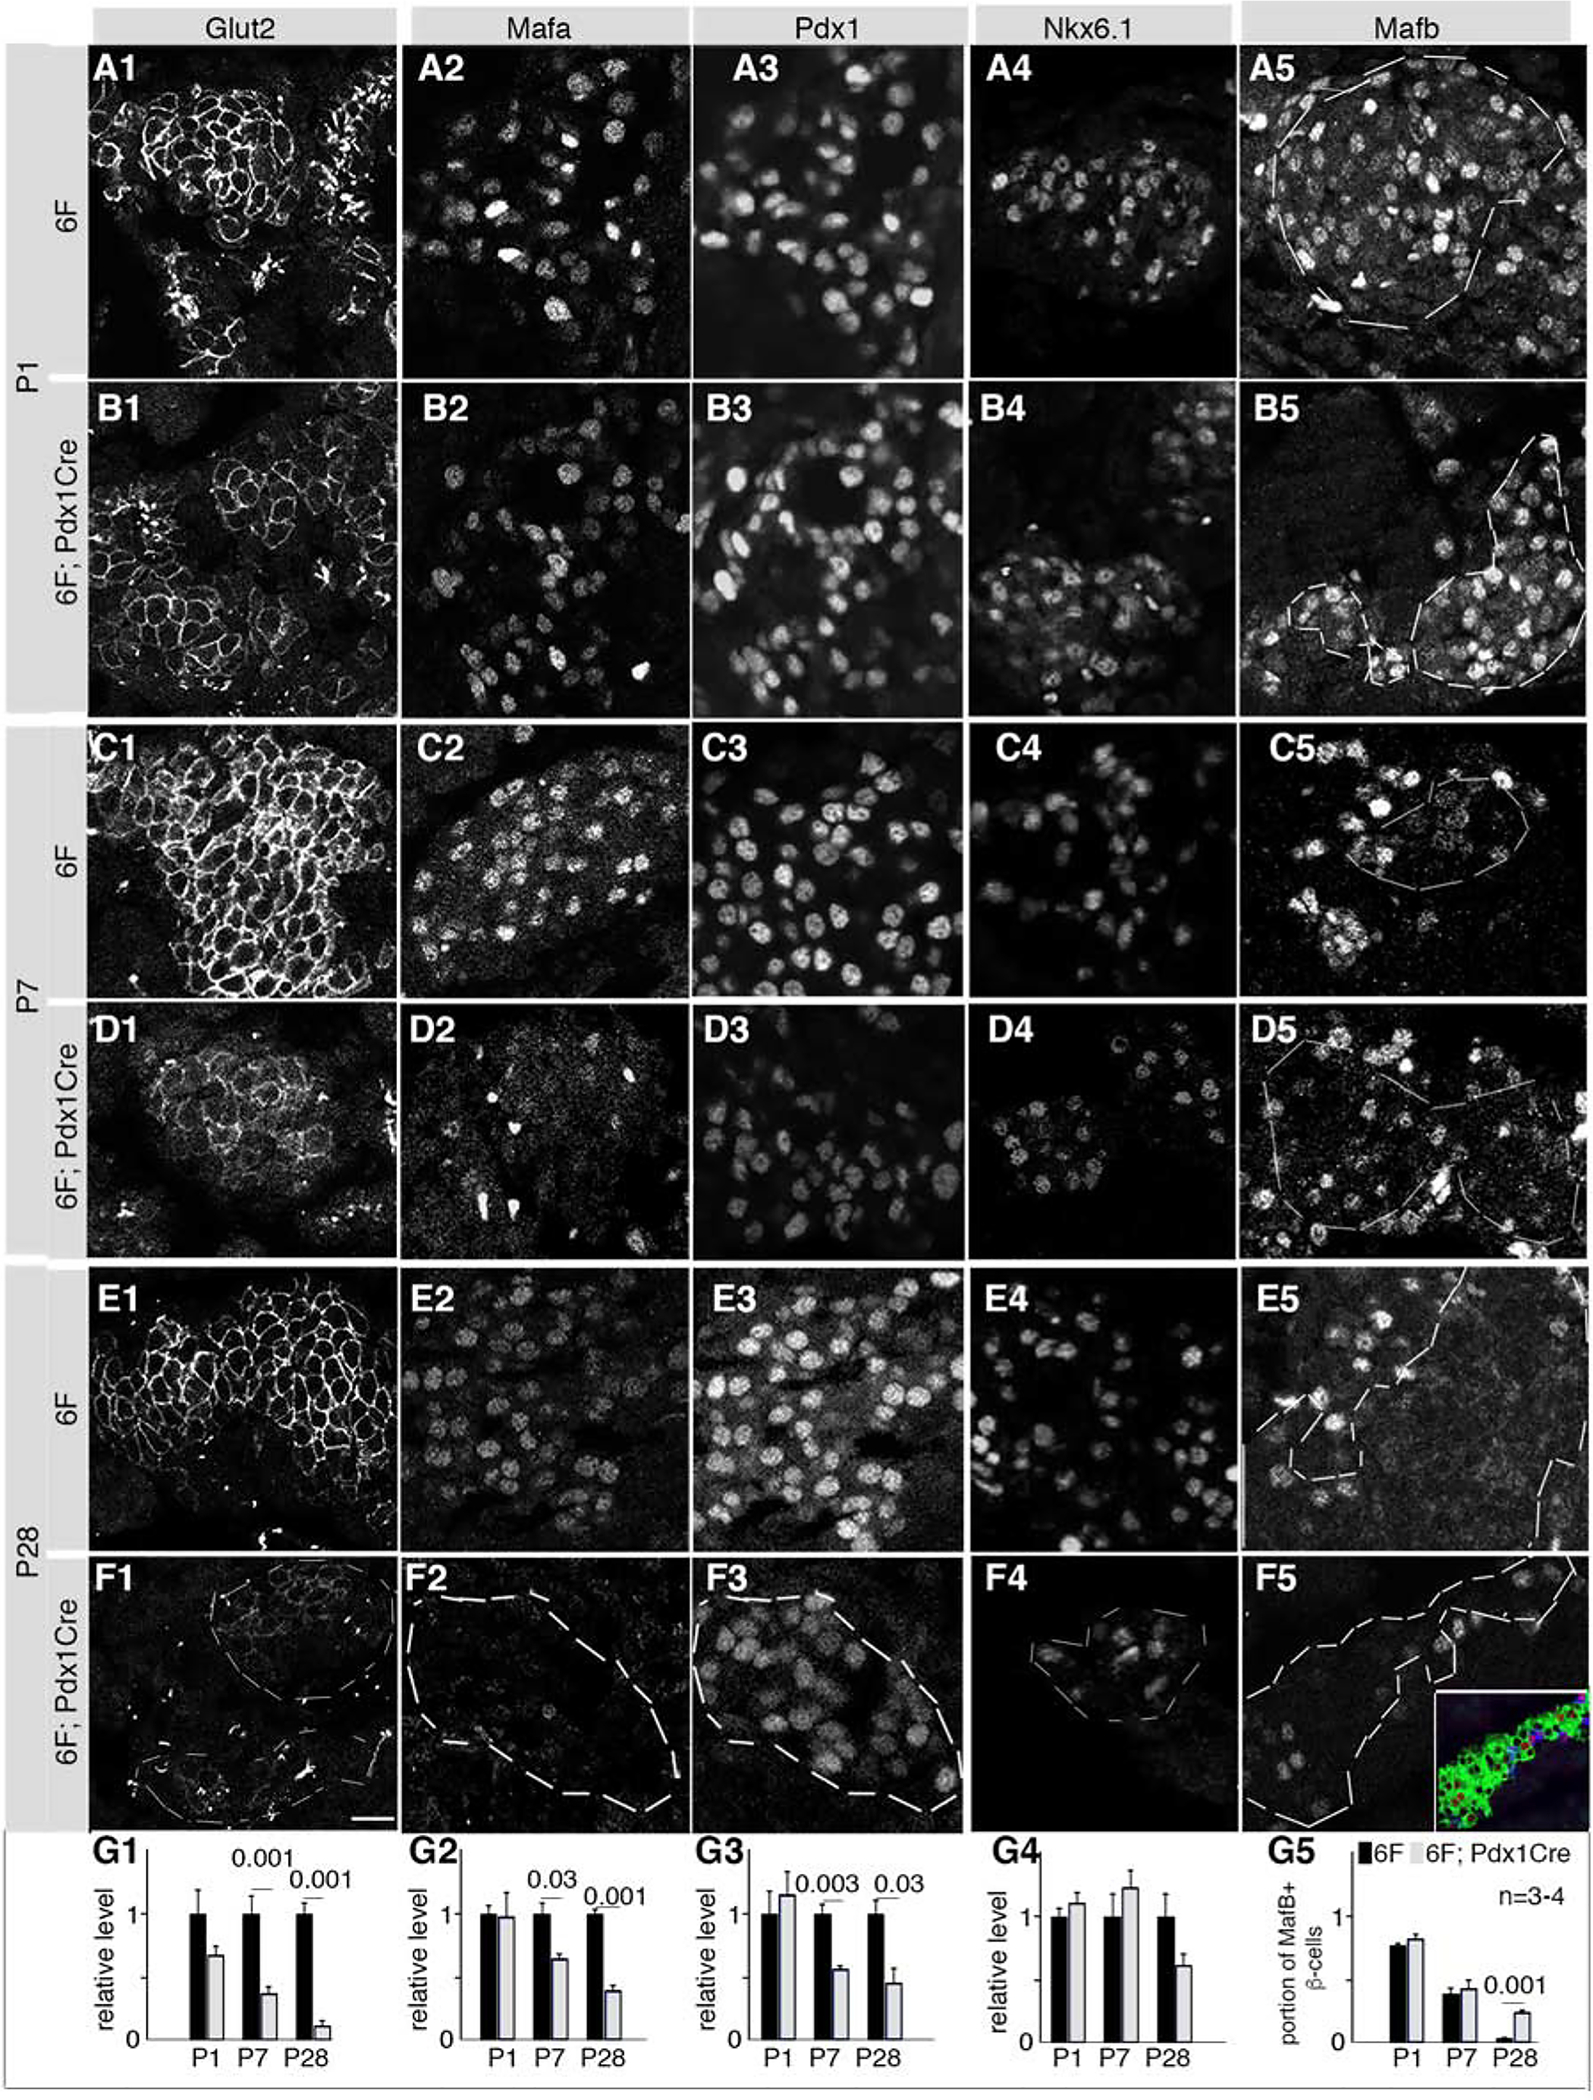
Also see Figure S2 and Table S1. Mice were derived from crosses between 6F and Myt1F/F; Myt2F/+; Myt3F/F; Pdx1Cre mice.
(A-F) Images of each assayed protein in islet cells in various stages and genotypes. Co-expression of insulin and/or Pdx1 located β-cells but are not shown [see inset in F5 (green: insulin, red: Mafb) as example]. Dotted lines in some panels circled β-cell areas (column 5) or islets (F1–F4). Scale bar in F1=20 μm, equal in all panels.
(G1–G5) Quantification of relative IF of corresponding markers (in each column) at various stages, assayed with Image J. Error bars, SEM. Three or four mice (“n”) were used for each assay. The p values (t-test, type 2, 2 tails) lower than 0.05 are indicated.