
Figure 3. Myt1 binds putative enhancers of several stress-response genes.
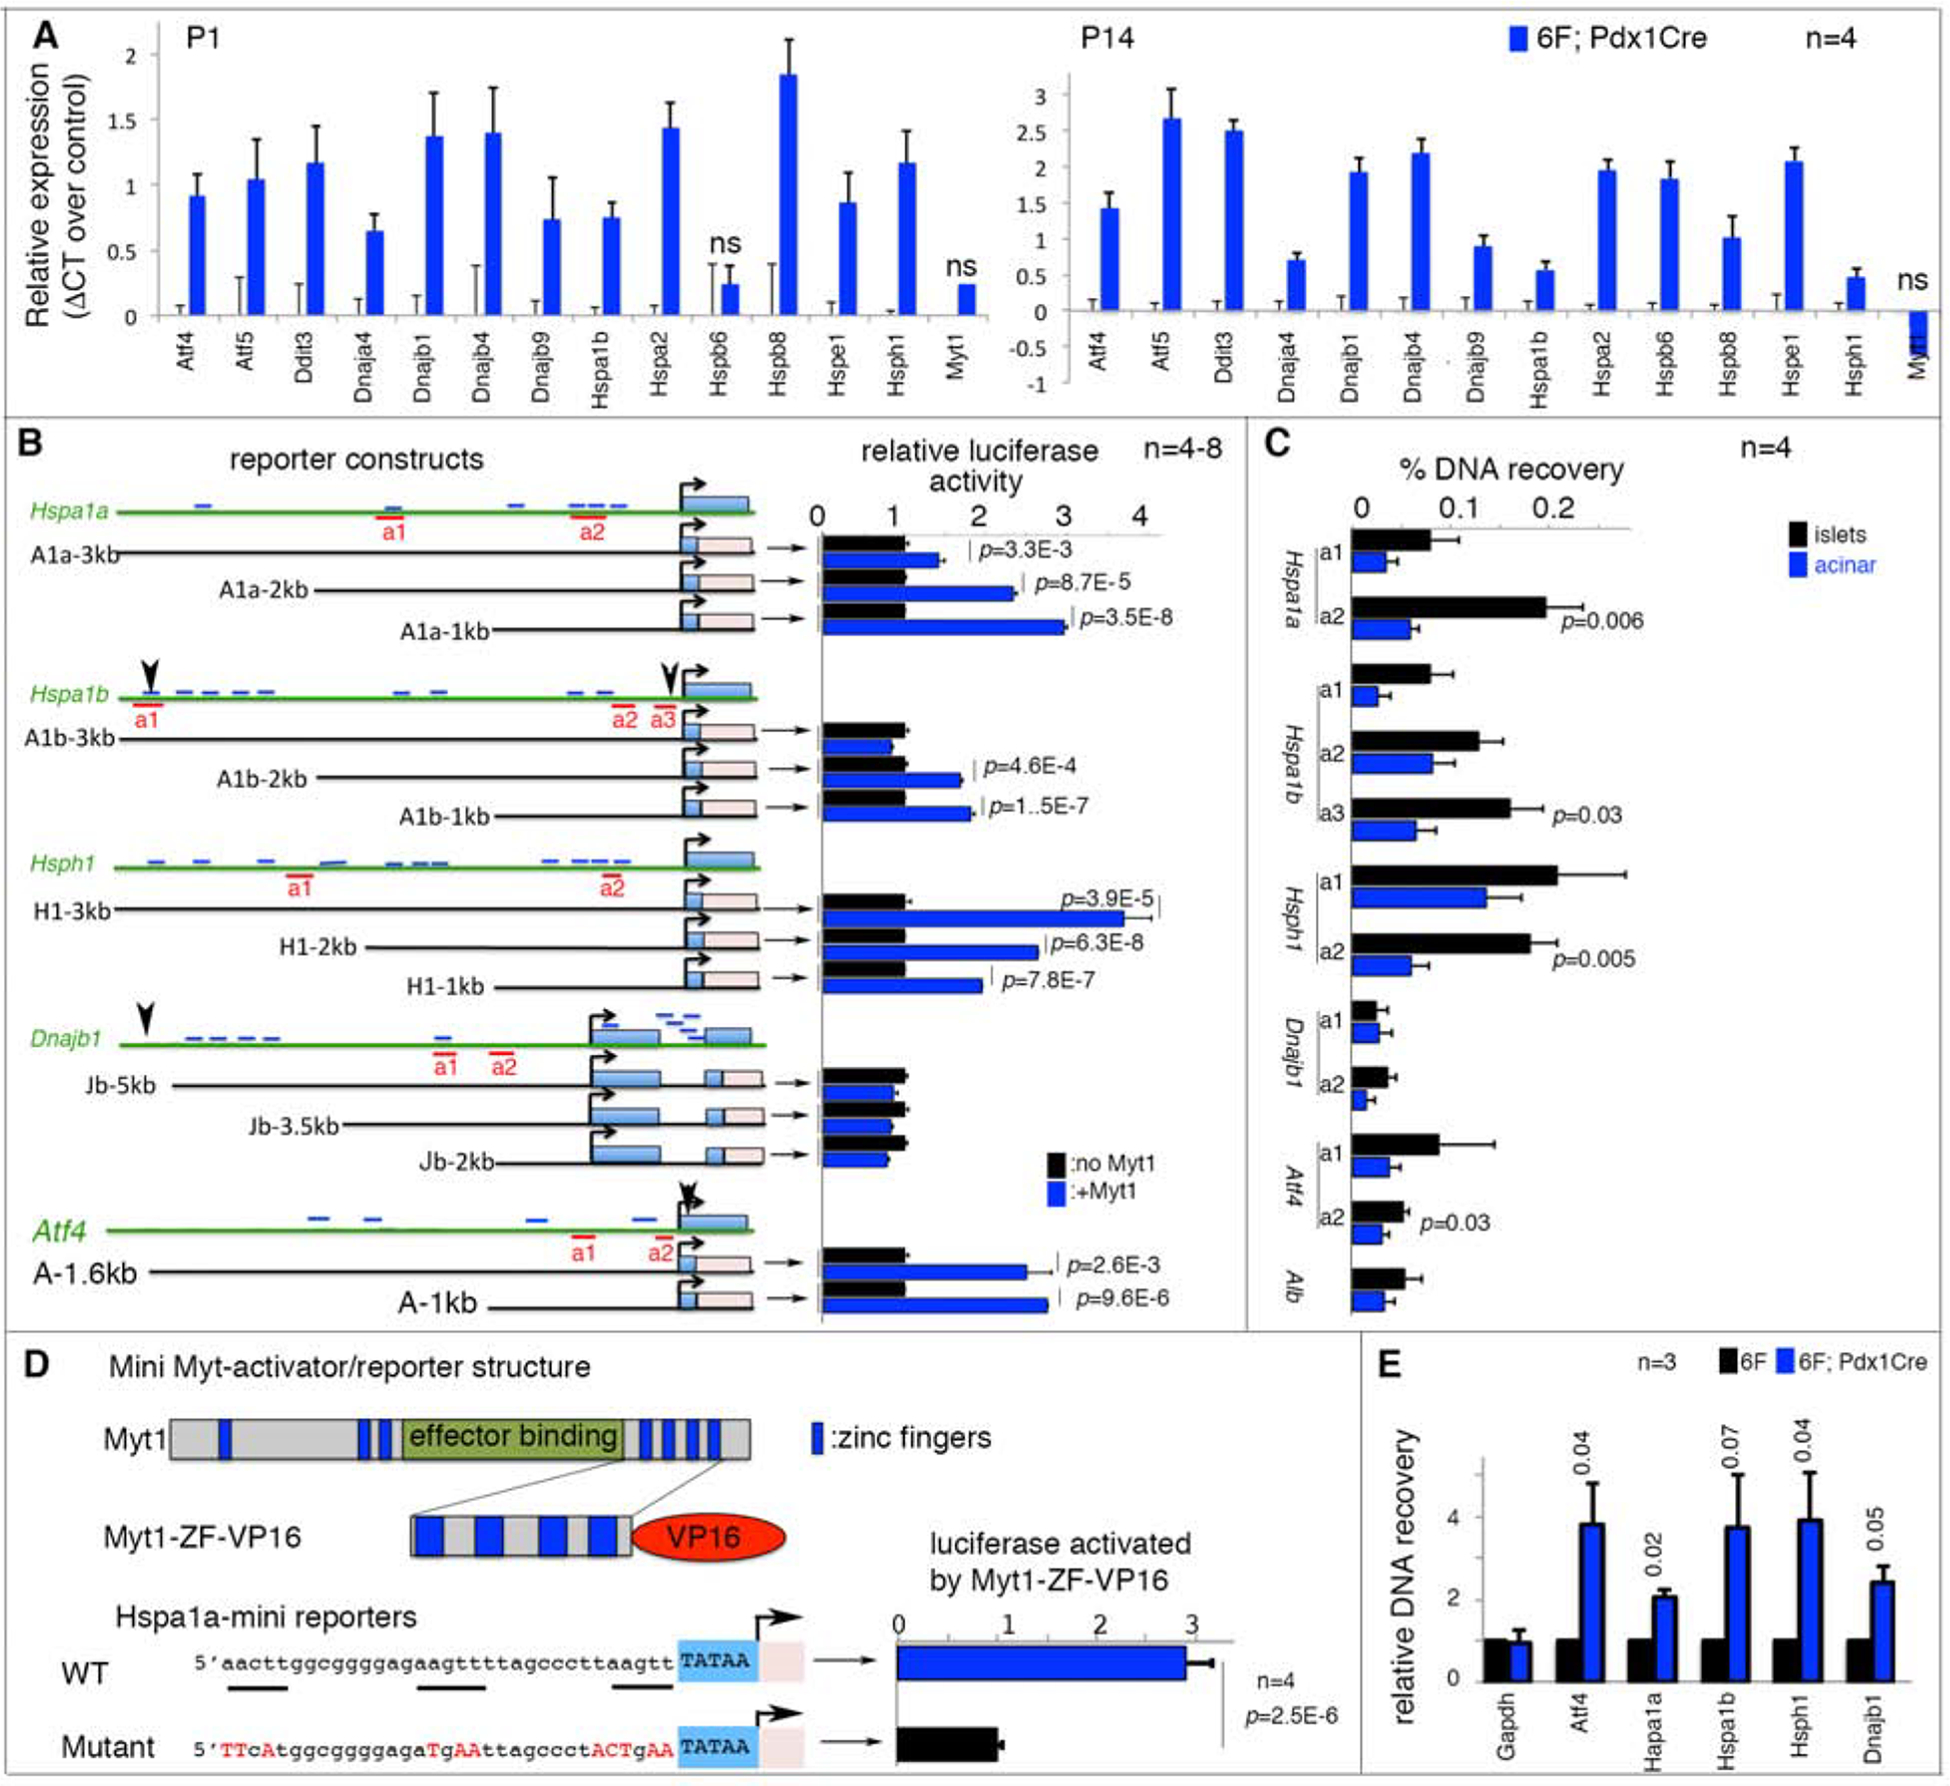
Also see Figure S3, S4, and Table S1. Error bars in all panels, SEM. p values in all quantification panels are from type 2, 2-tailed t-test.
(A) qPCR assays of mRNA levels in 6F and 6F; Pdx1Cre islets. “n”, number of mice, assayed as biological repeats. All expression changes except three marked “ns” are significant, with p<0.05.
(B) Reporter assays of stress-gene control elements. Diagrams on left: 5’ distal regions assayed. The approximate sizes (kb) of used regulatory regions are marked. Light-blue rectangles, stress-gene exons. Pink rectangles, firefly luciferase cDNA. Short blue lines, AAGTT motifs. Red underlines, amplicons for ChIP-PCR in panel C. Arrowheads (Hspa1b, Dnajb1, and Atf4), DNA elements reported to bind with Myt1 and/or Myt2 in heterologous cells. The right side bars in panel B, relative reporter activities assayed in HEK293T cells. p values <0.02 are marked.
(C) ChIP-PCR assays of Myt1 protein enrichment on putative stress-gene enhancers. Locations of PCR amplicons are shown in panel B. “n”, number of immunoprecipitations. p-values smaller than 0.05 are indicated. Acinar cells that do not express Myt1 were negative controls.
(D) Reporter assays using the “a2” Myt1-binding site of Hspa1a enhancers (a2 in panel B). The motif in wild type and mutated form was fused to a minimal CMV TATA box to produce reporters. The activator was a fusion protein between the C-terminal 4 zinc-fingers of Myt1 and a VP-16 activation domain. “n”, number of luciferase assays.
(E) ChIP-PCR assays of H3K27Ac in promoter regions of several stress genes using a rabbit anti-H3K27Ac antibody and chromatin of P14 6F or 6F; Pdx1Cre islets. The recovery was first normalized against DNA input in each sample. Recovery from 6F islets was then nominally set at 1 for group comparisons. “n”, number of chromatin preparations.