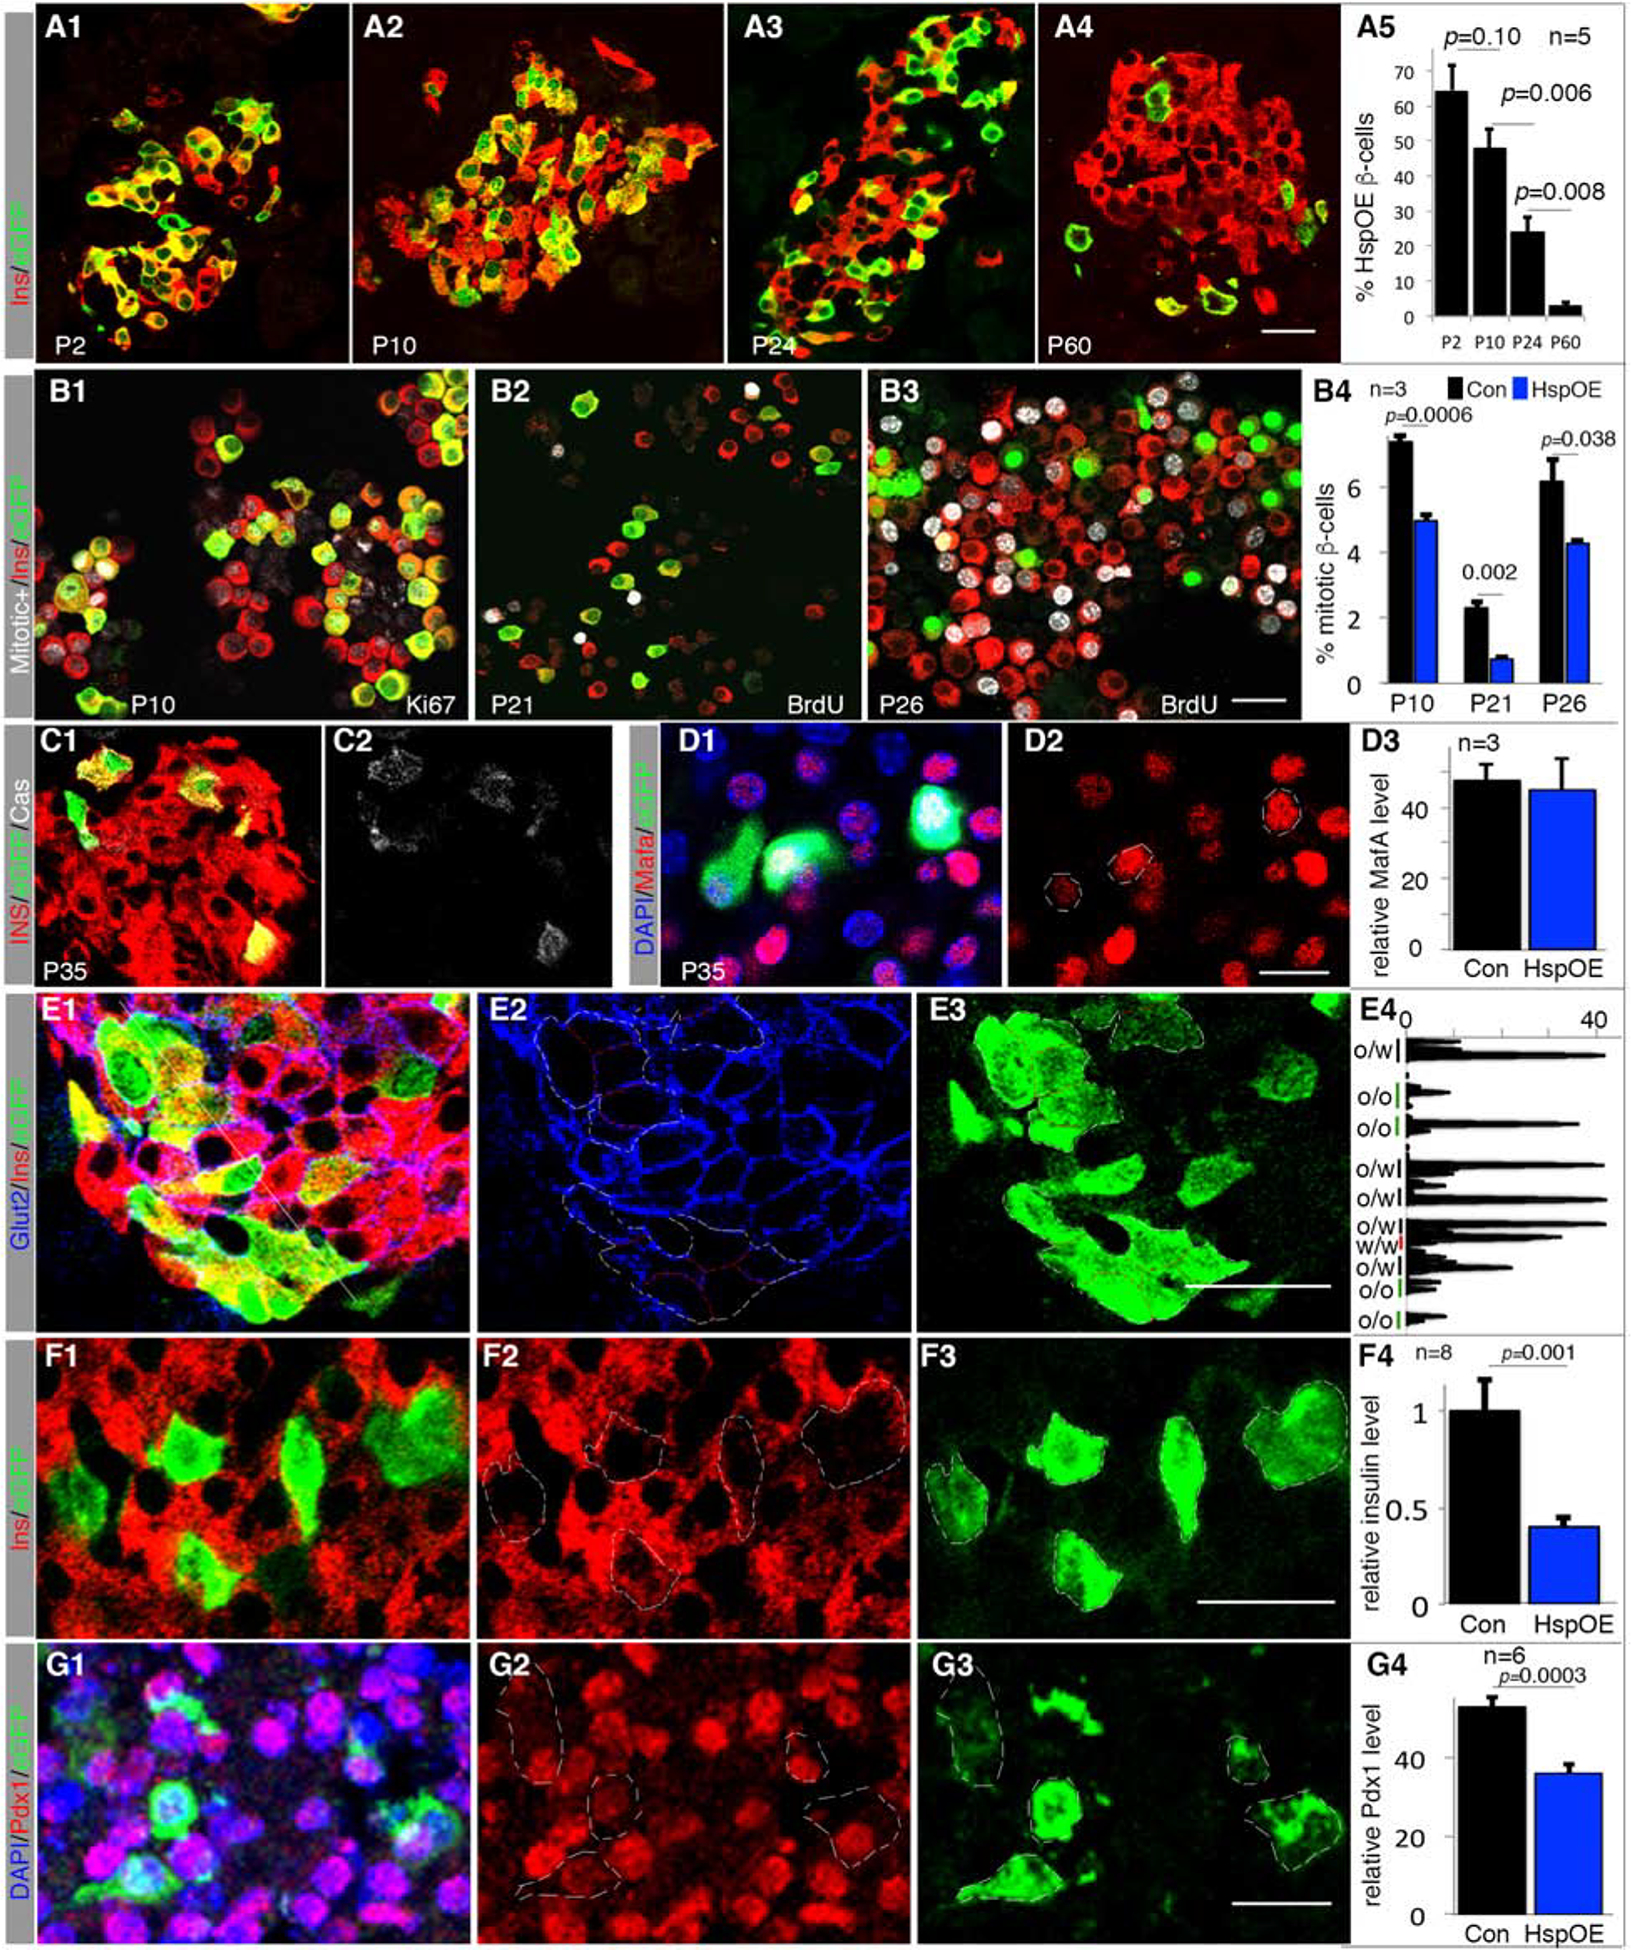
Figure 4. Hsp-OE compromises β-cell proliferation, identity, and survival.

Also see Figure S5 and Table S1. Error bars in all quantification panels, SEM. “n”, number of pancreata examined. “p” values in all quantifications are from type 2, 2-tailed t-test.
(A) Portion of Hsp-OE β-cells at several postnatal stages, monitored via eGFP expression. p-values are indicated.
(B) Mitotic activity of β-cells with (eGFP+ cells) or without Hsp-OE (eGFP− cells). P10 (B1) cells were assayed for Ki67, and P21 (B2) and P26 (B3) via BrdU incorporation (in water supply) between P19-P21 or P21-P26, respectively. Scale bar=20 μm. p-values are indicated.
(C-G) Expression of β-cell markers in P35 islets with Hsp-OE, quantified with ImageJ. E4 is a line scan (yellow thin line in E1, top-left to bottom-right), showing Glut2 intensity along the borders of OE (O) or non-OE (W) cells. p-values smaller than 0.05 are shown. White circles mark outlines of whole β-cells. Scale bars = 20 μm.
