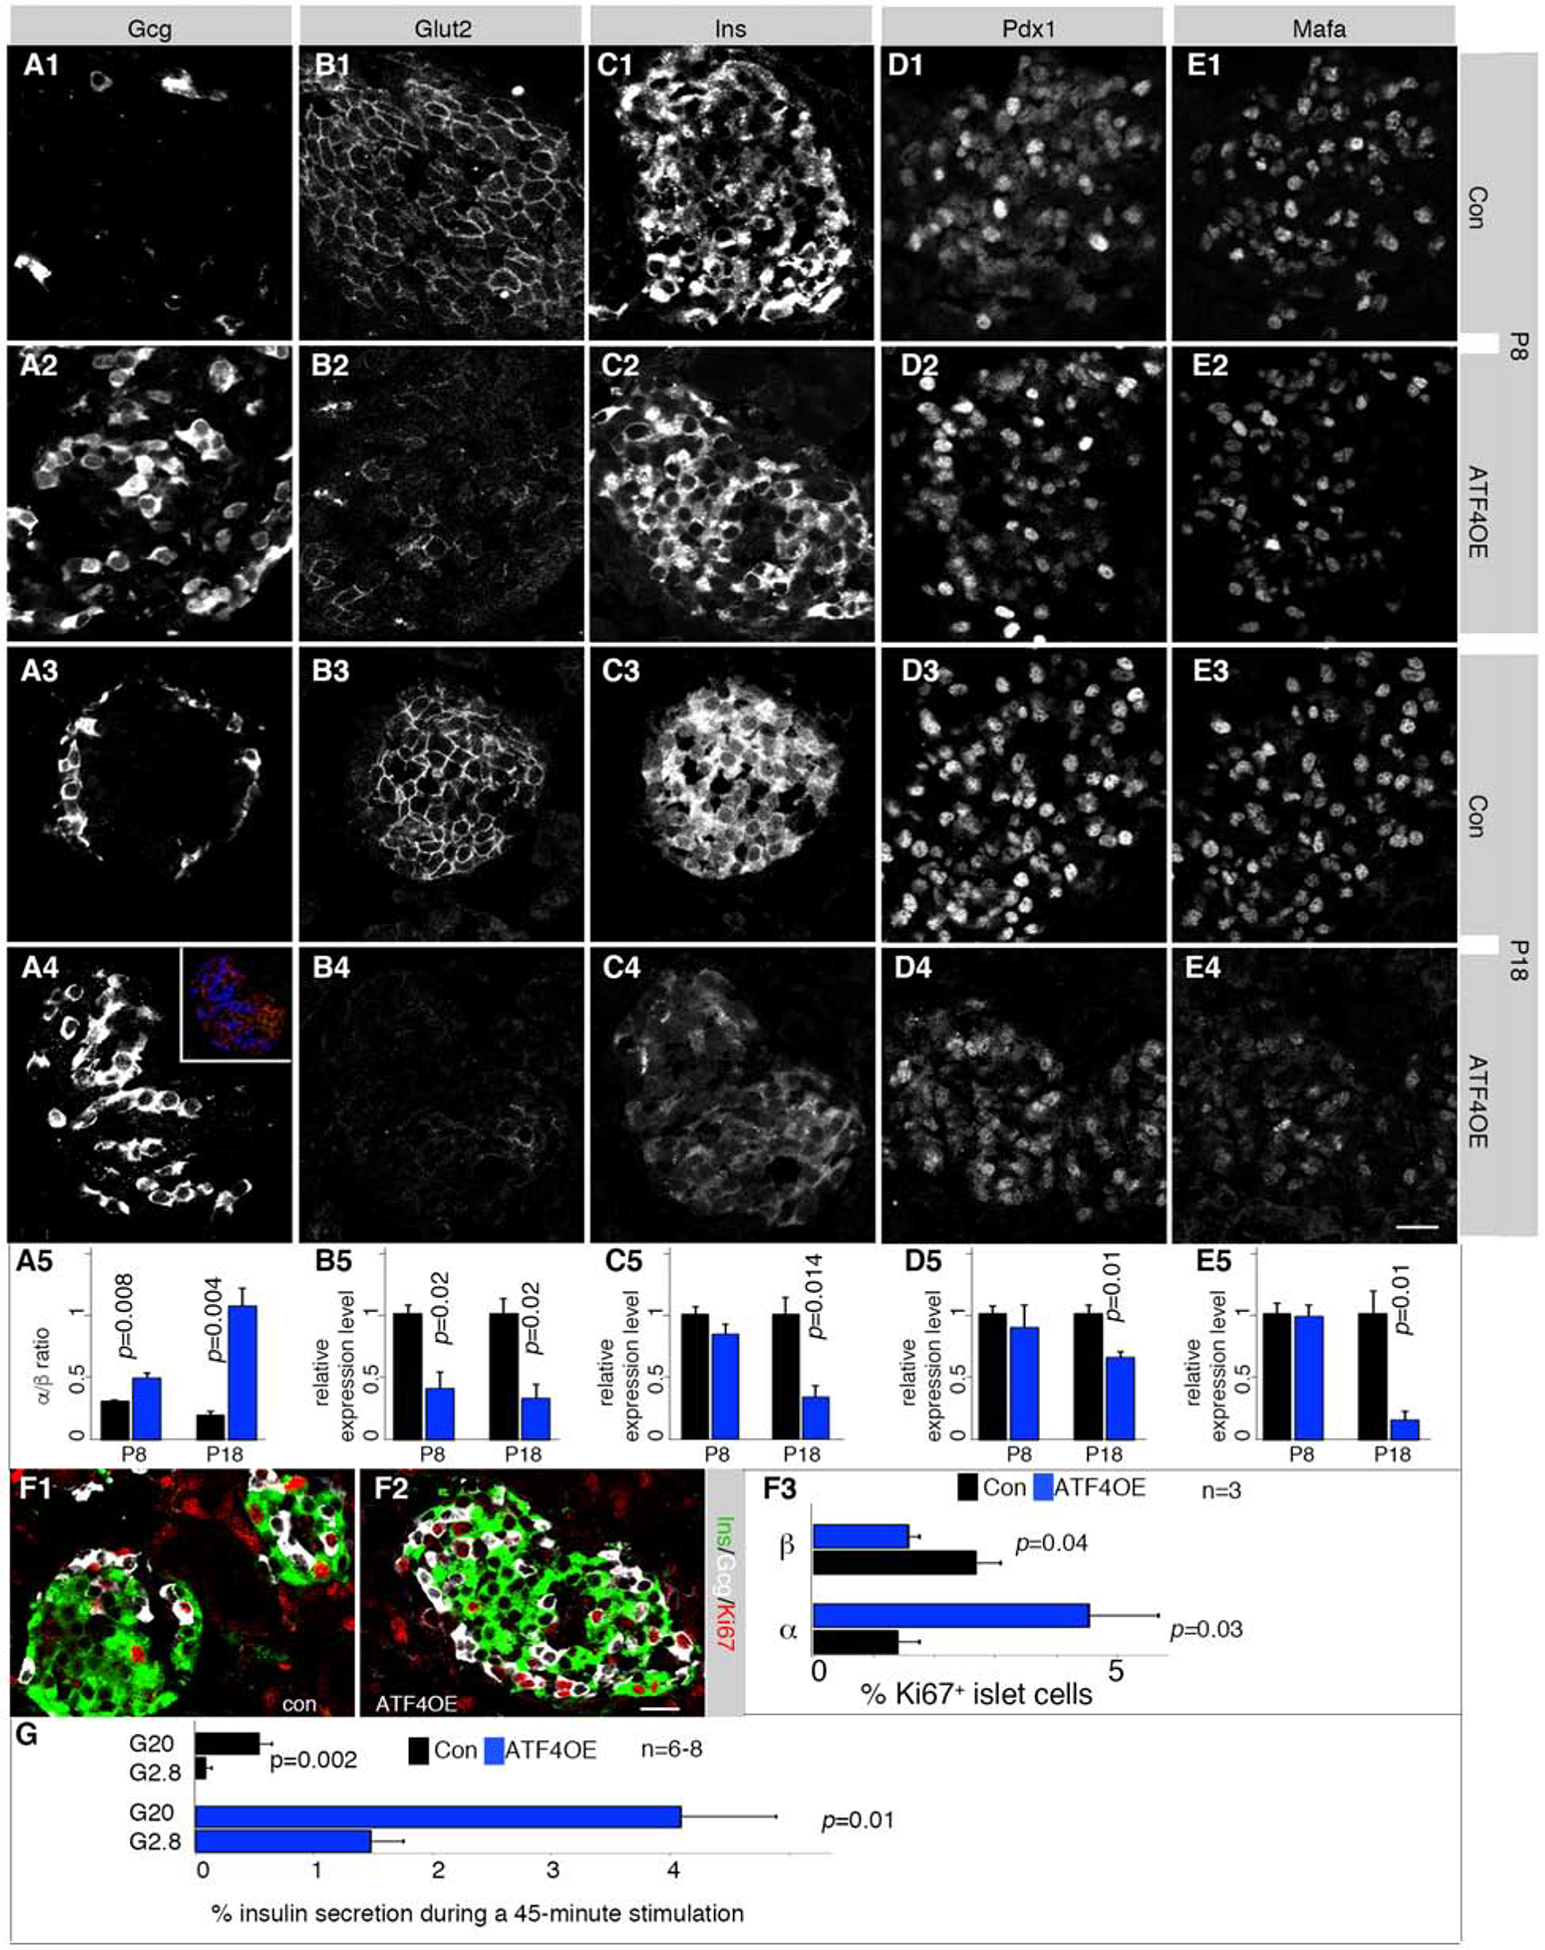
Figure 5. ATF4-OE compromises β-cell gene expression and insulin secretion.

Also see Figure S6 and Table S1. Error bars, SEM. “p” values in all quantification panels are from type 2, 2-tailed t-test.
(A-E) Detection of several β-cell markers. Controls (Con) are Rosa26-ATF4LoxTG pancreata. Inset in A4 is an example of how α (blue) and β (red) cells were identified. Three to four (n=3–4) pancreata were quantified for each marker. p-values <0.05 are marked. Scale bar in E4 = 20 μm, applicable to all panels.
(F) Mitotic assays via Ki67 staining. “n”, number of pancreata quantified. p-values are marked. Scale bar = 20 μm.
(G) GSIS results of P14 control and ATF4-OE islets. “n”, number of secretion assays from 3 mice (each having at least two technical duplicates).
