
Figure 6. Myt (MYT) TF up-regulation in mouse β-cells during compensation but down-regulation in dysfunctional human β-cells.
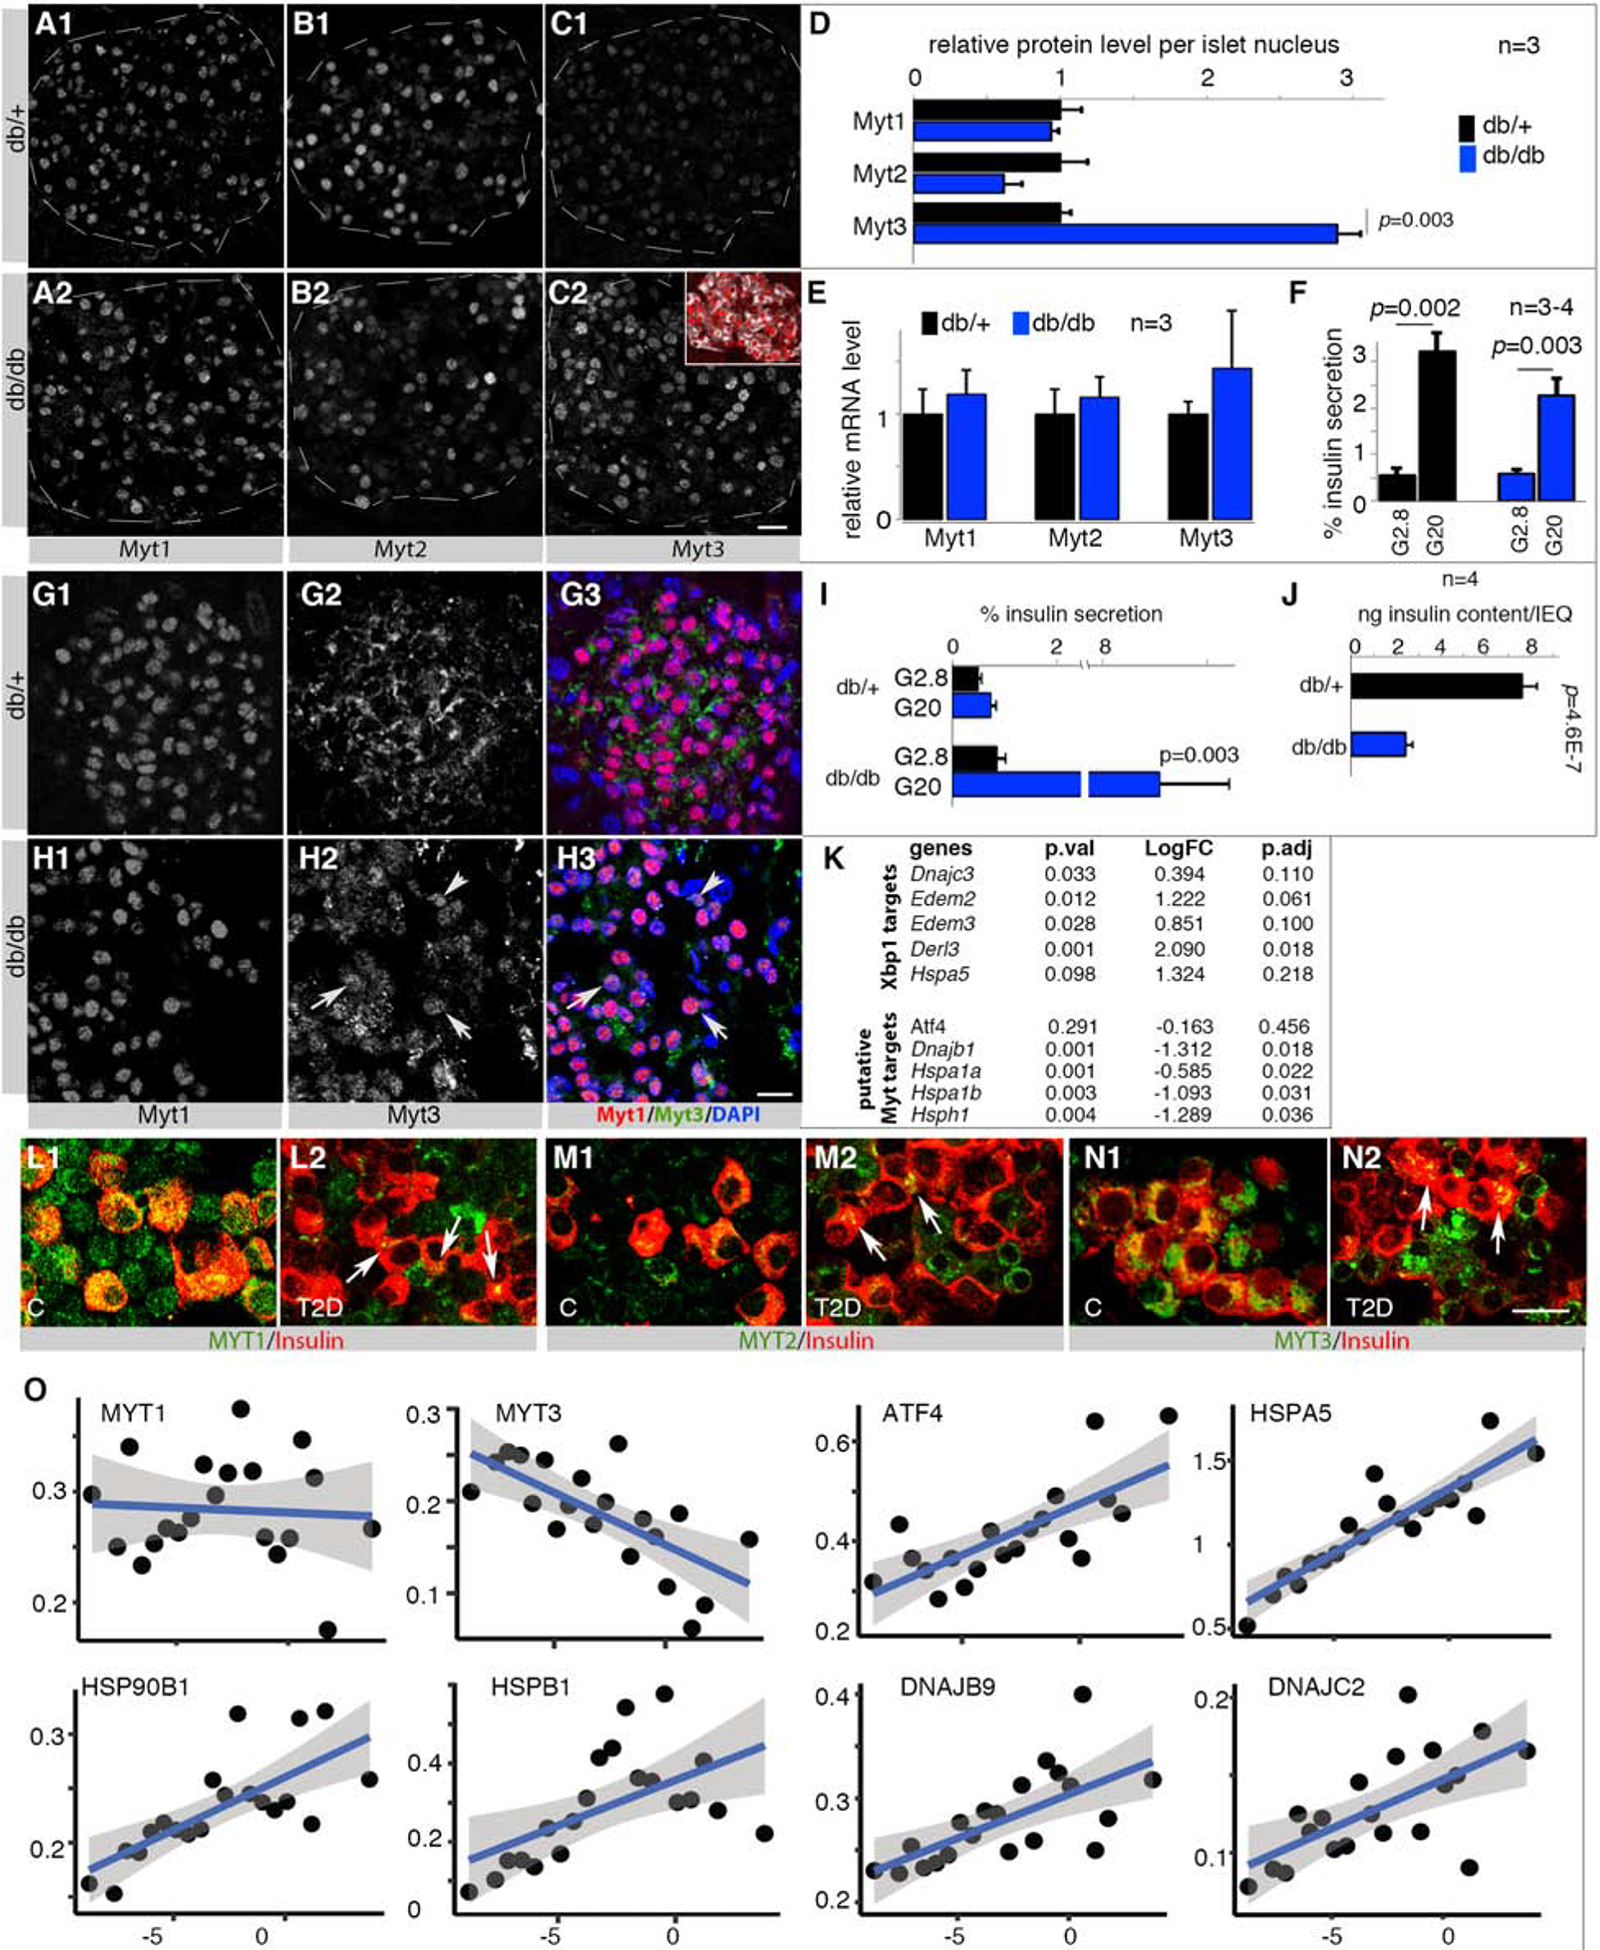
Also see Figure S7 and Table S1, S4, S5. Error bars in all quantification panels, SEM. “p” values in all quantification panels are from type 2, 2-tailed t-test.
(A-F) Myt TF at the protein (A-D) or mRNA (E) level in 3-month-old islet cells of db/+ and db/db mice that maintain GSIS (F). Inset in C2 shows β-cells (Insulin+, white) that express Myt3 (red). “n”, number of mice examined. p-values <0.05 are marked. Scale bar in C2 = 20 μm, applicable from A-C.
(G, H) Myt1/Myt3 detection in 18-month-old db/+ and db/db islets. Arrows in H2 and H3 point to examples with nuclear Myt3. Scale bar = 20 μm.
(I, J) GSIS assays of 18-month old islets, presented as % of insulin secretion within a 45-minutes stimulation window or total insulin content per islet-equivalency (IEQ).
(K) Gene-expression changes (log-fold change or LogFC, detected via RNA-seq) between 3-month-old db/db and db/+ islets; representative examples presented. See Table S4 for more genes.
(L-N) MYT TF expression in normal and T2D donor islets. Arrows in M2, N2, and O2 point to several β-cells with low but detectable MYT TFs. Scale bar = 20 μm.
(O) RePACT-analysis of MYT and stress gene transcription in ~35,000 β-cells of six normal and 3 T2D islet donors. X-axis, pseudo-time trajectory of T2D progression (left to right). Y-axis, relative gene expression. Each dot represents a β-cell subpopulation. The blue line represents average gene-expression trajectory. Blue shades indicate range of gene expression with 95% confidence levels.