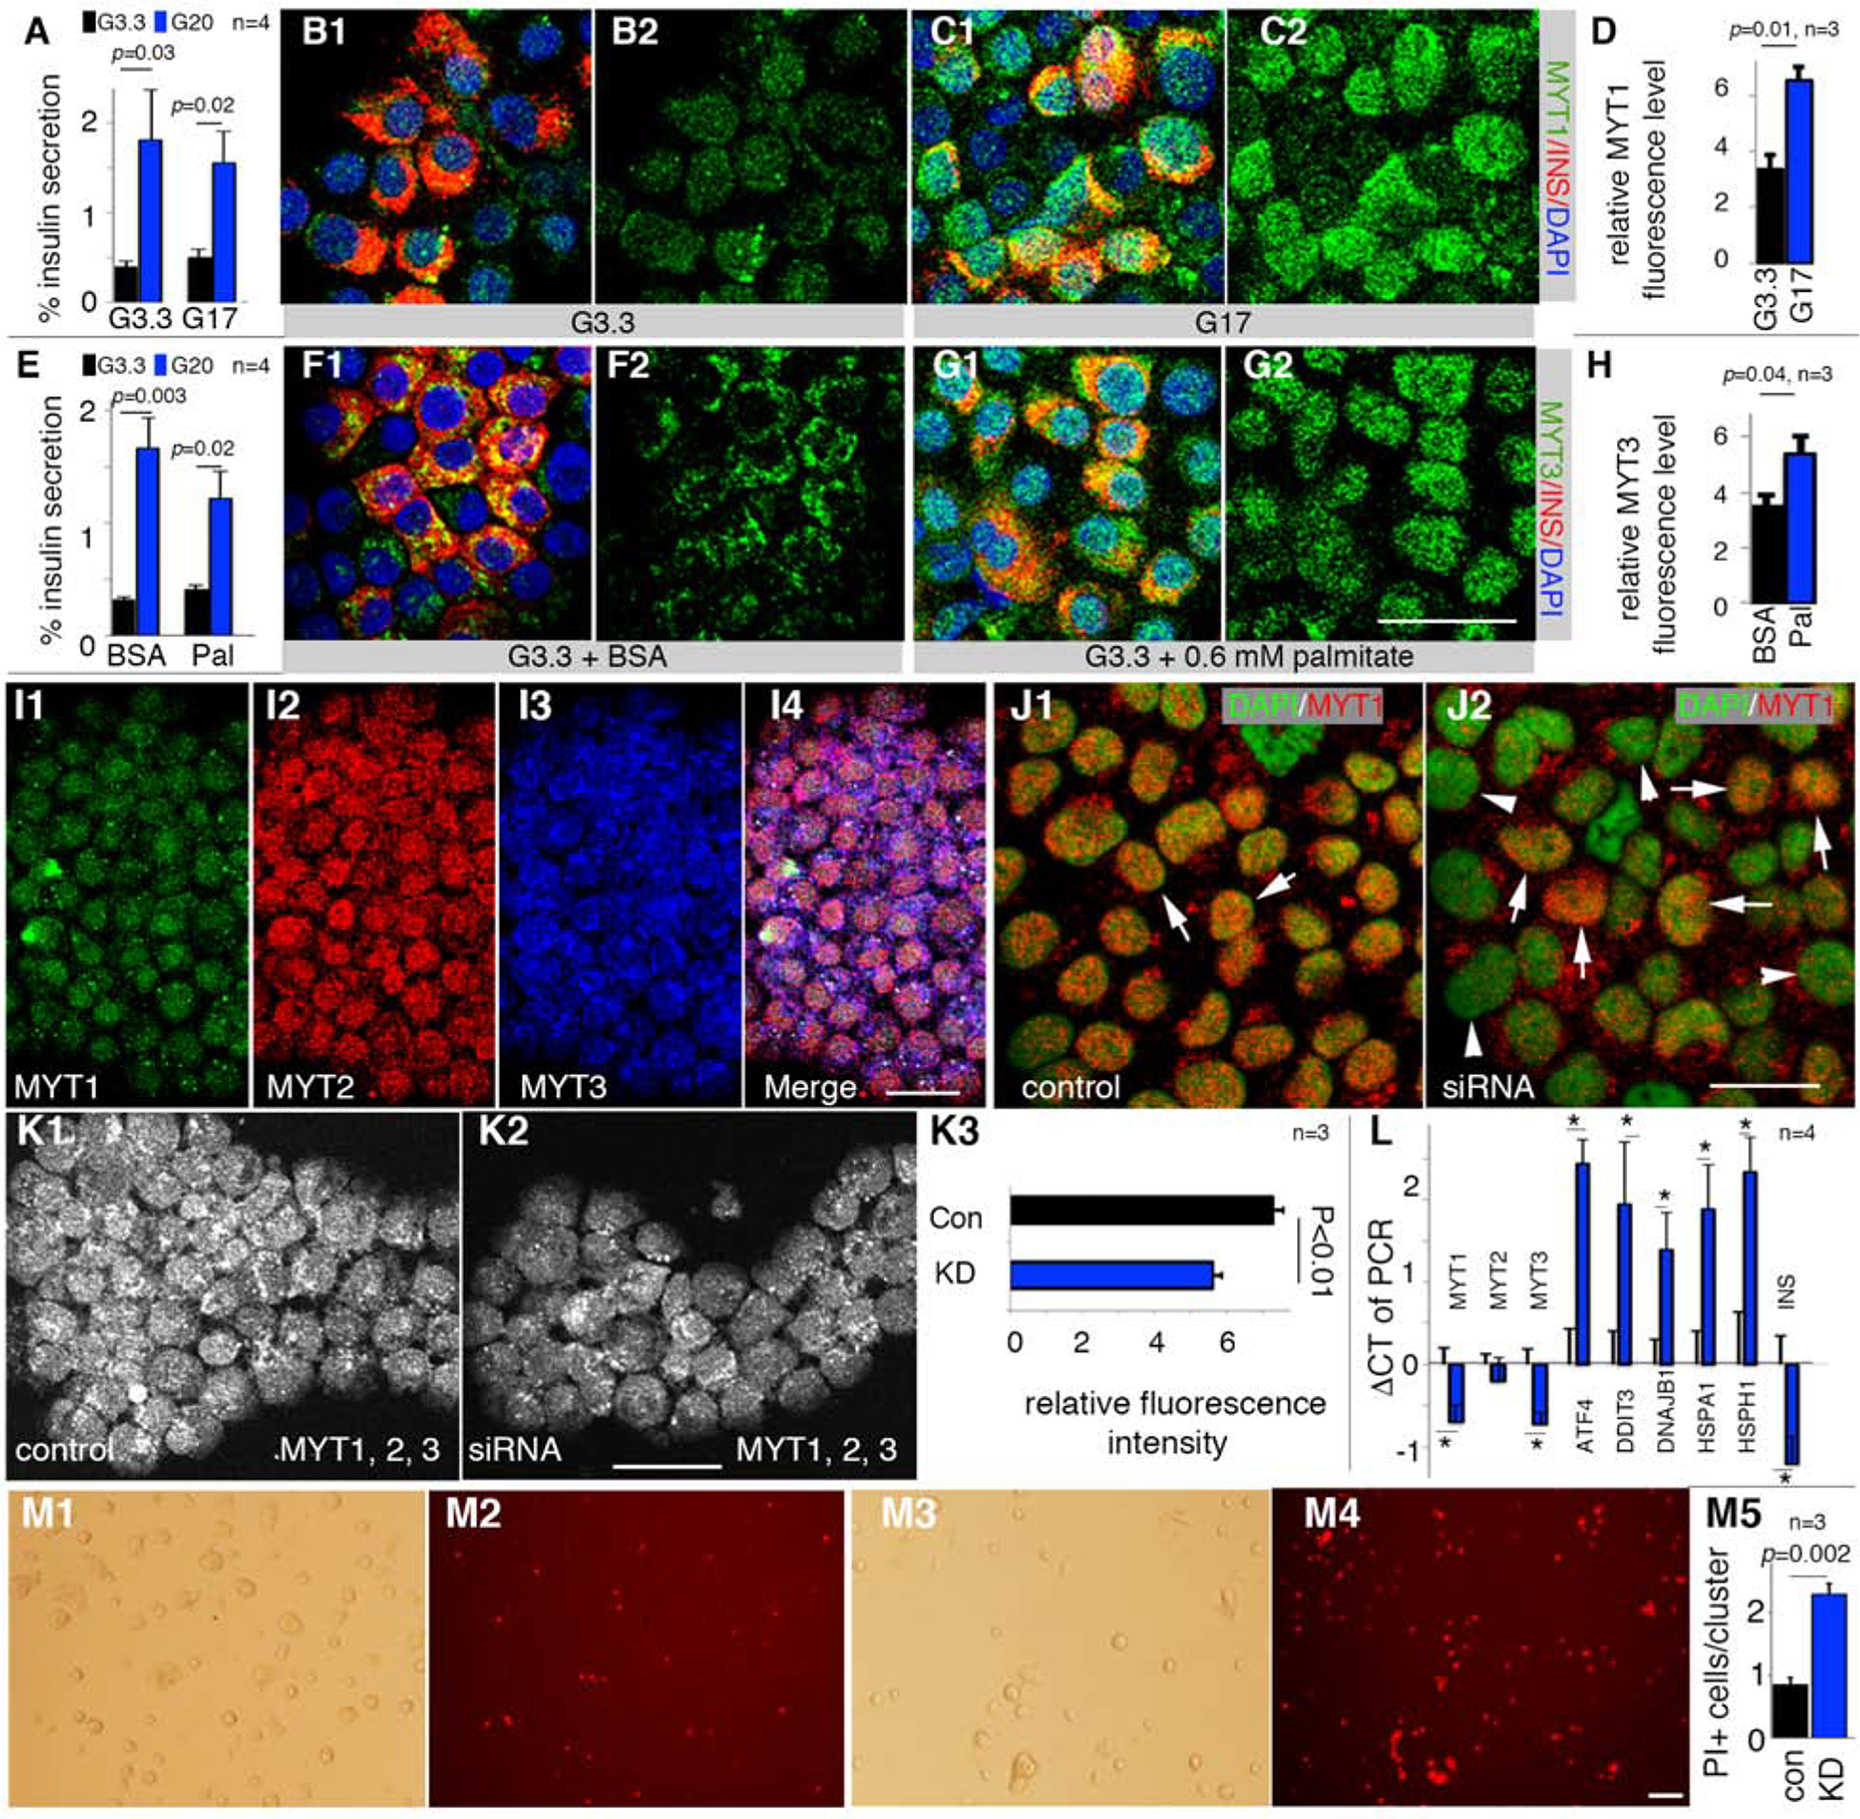
Figure 7. Human MYT TFs are responsive to metabolic stress and required for human β-cell line survival.

Also see Figure S7 and Table S1. Error bars in all quantification panels, SEM. “p” values in all quantification panels are from type 2, 2-tailed t-test.
(A-D) GSIS [A, under 3.3 mM (G3.3) and 20 mM (G20) glucose] and MYT1 production of human β-cells after 40-hour treatment with 17 mM (G17) glucose. A merged MYT1/Insulin and single MYT1 channel are shown. “n” in panel a, number of GSIS assays. “n” in D, batches of islets used. Scale bar = 20 μm.
(E-H) Same as A-D with 0.6 mM palmitate (Pal) instead of G17.
(I) MYT TF detection in EndoC-βH1 cells. Scale bar = 20 μm.
(J) siRNA-based MYT1 KD three days after siRNA transfection. Arrows, MYT1+ nuclei. Arrowheads, cells with lowered MYT1 signal. Scale bar = 20 μm.
(K) Staining and quantification of MYT TFs in viable EndoC-βH1 cells after MYT KD. MYT1, 2, 3 signals were combined into one single channel (K1, K2) and quantified with Image J (K3). “n”, batches of KDs; 10–15 cell clusters (i.e. island-like cell aggregates wherein cells proliferate) in each sample. Scale bar = 20 μm.
(L) Effect of MYT KD on transcription of several stress genes in EndoC-βH1 cells. “*”, p<0.05. “n”, batches of KDs.
(M) Propidium iodide (PI) assays of cell death three days after MYT TF KD. Bright field and PI fluorescence are shown. M1 and M2, cells transfected with control siRNA. M3 and M4, cells transfected with cocktails of siRNA that target MYT1, 2, and 3. Quantification was number of PI+ cells per cell cluster. Scale bar = 100 μm. “n”, batches of KDs.
