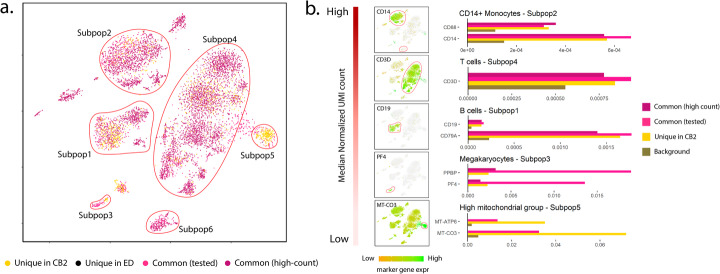
Fig. 3.
Results from the PBMC8K dataset. a t-SNE plot of cells identified by CB2 and ED. High-count barcodes exceeding an upper threshold are identified as real cells by both methods without a statistical test (dark pink); barcodes identified as cells by both methods following statistical test are shown in pink. Cells identified uniquely by CB2 (yellow) and ED (black) are also shown. CB2 increases the number of cells identified across the six subpopulations by over 80% (Additional file 2: Table S1). b Subpopulations 1–5 ordered by median normalized UMI count along with marker gene expression for each subpopulation. Marker gene expression in cells uniquely identified by CB2 is similar to that in other groups, and differs from the background. Subpopulation 5 contained no high-count common cells; subpopulation 6 contained no unique CB2 identifications and is therefore not shown in panel b

