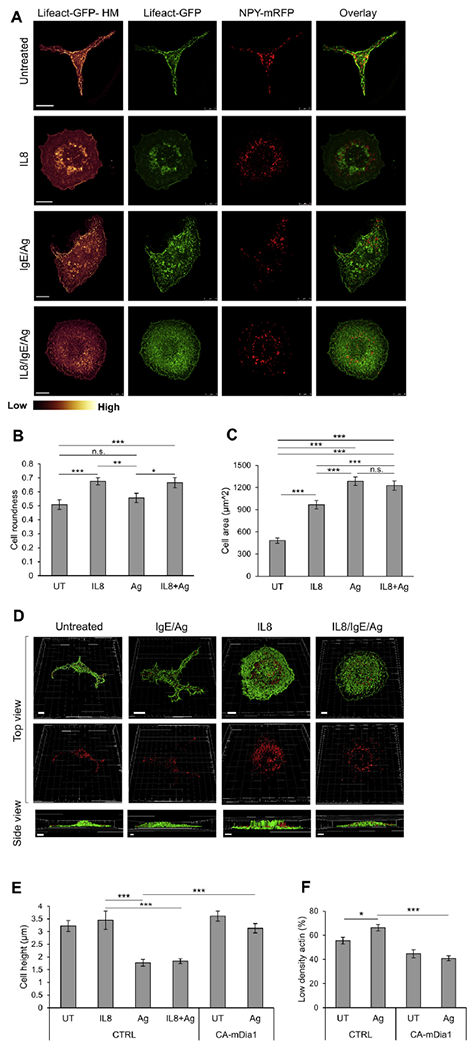
FIG 3.

Characterization of the actin meshwork, cell height, and SG distribution under migratory and secretory conditions. A, RBL-CXCR1 cells were transiently cotransfected with 10 μg of LifeAct-GFP (green) and 15 μg of NPY-mRFP (red) sensitized with 0.25 μg/mL IgE and either left untreated (UT) or triggered for 30 minutes with 50 ng/mL IL-8, 50 ng/mL DNP-HSA (IgE/Ag), or IL-8 followed by DNP-HSA (IL8/IgE/Ag), as indicated. Cells were processed for microscopy, as described in the Methods section, and imaged with a Leica SP5 confocal microscope. LifeAct-GFP fluorescence is also presented as heat maps (Lifeact-HM). Scale bars = 10 μm. B, Cell roundness (range, 0-1) was calculated by tracing the cells’ footprints and using the roundness measurement parameter in ImageJ software. *P = .034, **P = .007, and ***P ≤ 3E-3 (n ≥ 20 for each treatment from at least 3 different experiments). C, Cell area was calculated by tracing the cells’ footprints and using the area measurement parameter in ImageJ software. ***P≤3E-3 (n ≥ 20 for each treatment from at least 3 different experiments). D, Confocal images were 3-dimensionally reconstructed by using Imaris software. Scale bars = 5 μm. E, Quantification of the average cell height derived from 3-dimensional images of cells transfected with 30 mg of either empty vector (CTRL) or CA mDia1, as indicated. Cells were either left untreated (UT) or triggered for 30 minutes with IL-8, IgE/antigen, or IL-8 followed by antigen. ***P< 8.4E-4 (n = 15 cells for each treatment). F, Quantification of LifeAct-GFP fluorescence in RBL-CXCR1 cells cotransfected with LifeAct-GFP and either empty vector (CTRL) or CA mDia1, as in Fig 3, E. Cells were IgE sensitized with 0.25 μg/mL IgE and either left untreated (UT) or activated for 30 minutes by 50 ng/mL DNP-HSA (Ag), as indicated. Cells were imaged at the footprint with a Leica SP5 confocal microscope. The LifeAct-GFP signal was classified as low or high according to a uniform threshold and quantified as the percentage of cell area with low/high-density actin per cell. Quantification is based on 9 (UT) to 25 cells derived from 3 separate experiments. *P = 1.23E-2 and ***P = 3.23E-7. n.s., Not significant.
