
FIG 4.
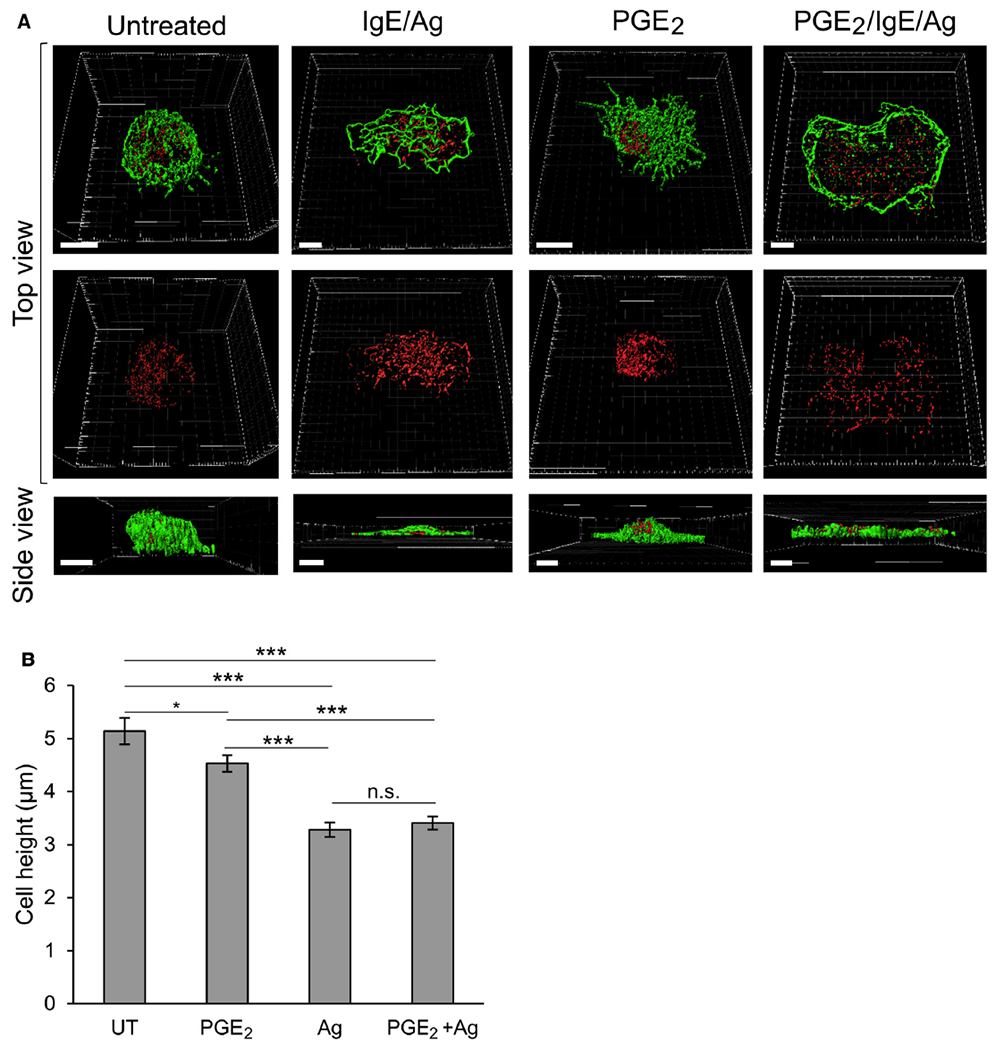
Three-dimensional characterization of BMMCs, cell height, and SG distribution under migratory and secretory conditions. A, BMMCs were sensitized with 0.25 μg/mL IgE and either left untreated (UT) or triggered for 30 minutes with 100 nmol/L PGE2, 50 ng/mL DNP-HSA (IgE/Ag), or PGE2, followed by DNP-HSA, as indicated. Cells were stained with anti-syntaxin 3 antibodies and Alexa Fluor 647 phalloidin and processed for microscopy, as described in the Methods section. Images were taken with a Leica SP5 confocal microscope and 3-dimensionally reconstructed by using Imaris software. Scale bars = 5 μm. B, Quantification o average cell height derived from the 3-dimensional images of BMMCs that were either left untreated (UT) or triggered for 30 minutes with PGE2, IgE/antigen, or PGE2 followed by antigen. *P< .04 and ***P < 1.57E-7 (n ≥46 cells for each treatment). n.s., Not significant.