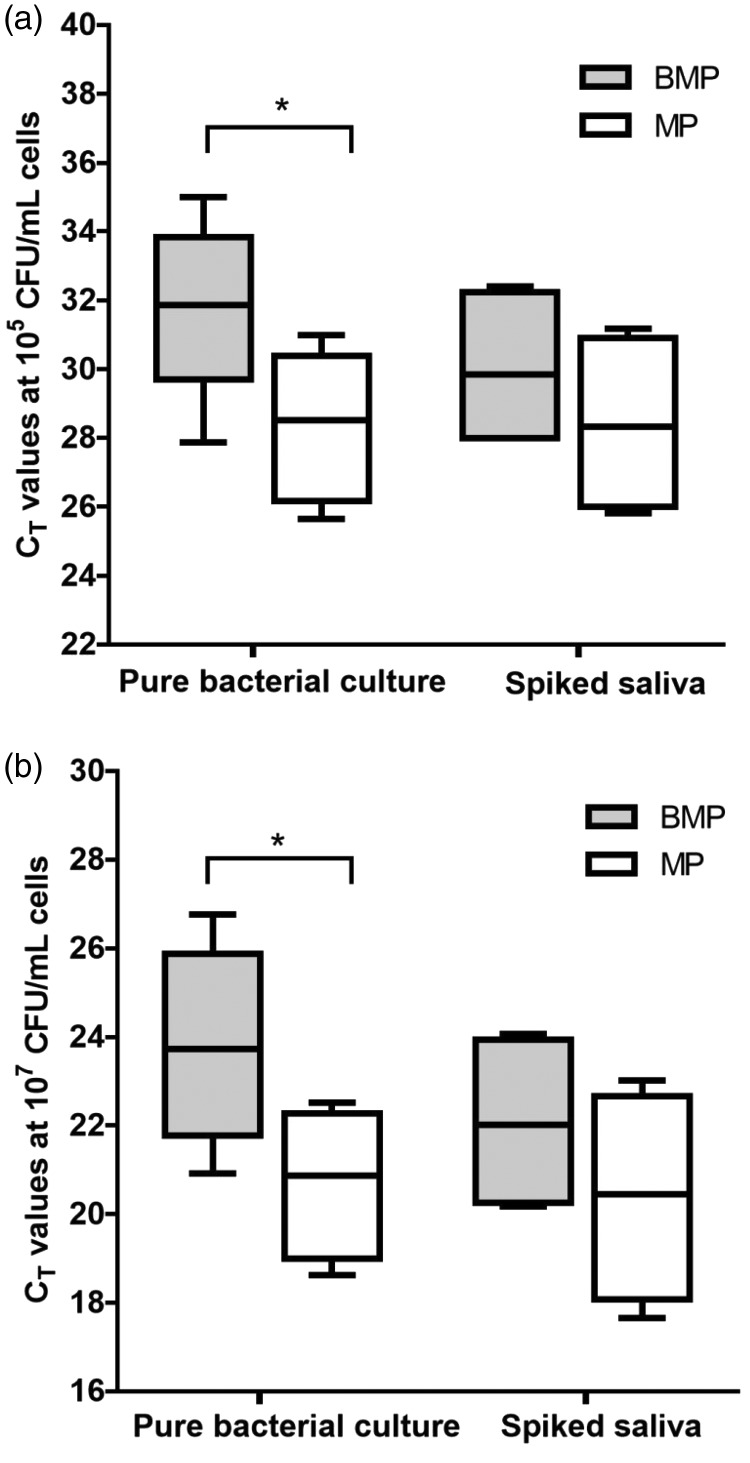
Figure 2.
Comparison of the CT values obtained with the two gDNA extraction methods when targeting Gram-negative bacterial cultures. The samples comprised (a) 105 CFU/mL or (b) 107 CFU/mL of each bacterial species. The CT values were used as a measure of the gDNA yields when using the BMP method (gray boxes) or the MP method (white boxes). The box plots indicate the mean and range of the data (n = 3 per group), *P < 0.05.

