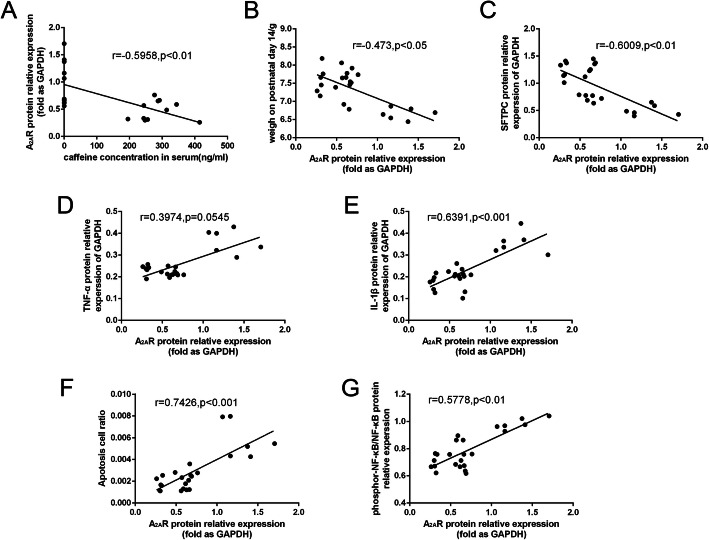
Fig. 7.
The correlations among serum caffeine concentration, A2AR protein and lung injury outcomes. a The correlation of serum caffeine concentration and A2AR protein, n = 24, r = − 0.5958, P < 0.01. b The correlation of A2AR protein and mice body weight on P14, n = 24, r = − 0.473, P < 0.05. c The correlation of A2AR protein and SFTPC protein, n = 24, r = − 0.6009, P < 0.01. d The correlation of A2AR protein and TNF-α, n = 24, r = 0.3974, P = 0.0545. e The correlation of A2AR protein and IL-1β, n = 24, r = 0.6391, P < 0.001. f The correlation of A2AR protein and apotosis cell, n = 24, r = 0.7426, P < 0.001. g The correlation of A2AR protein and phosphor-NF-κB, n = 24, r = 0.5778, P < 0.01

