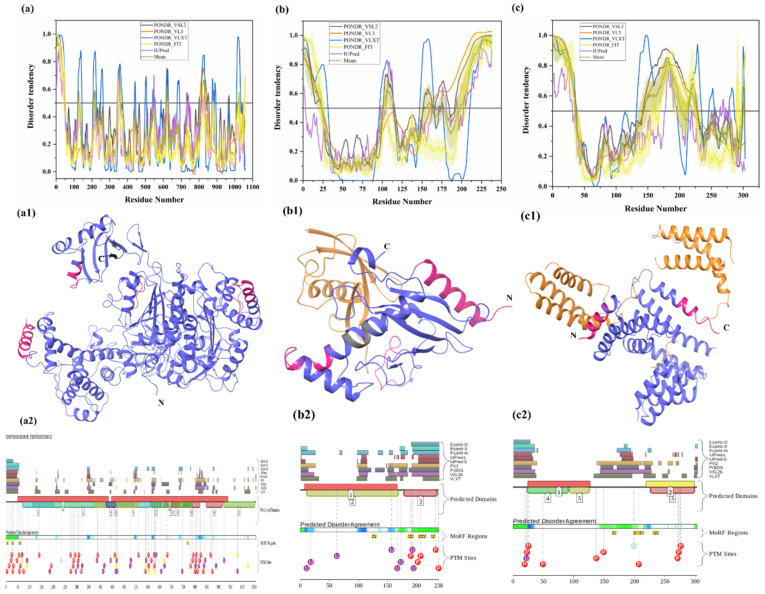
Figure 4.
Intrinsic disorder in ubiquitinating enzymes E1 (UBA1), E2 (UBE2R2) and E3 (STUB1). (a) ubiquitin-activating enzyme E1 (UniProt ID: P22314), (a1) crystal structure of the E1 enzyme (PDB ID: 6DC6). (b) ubiquitin-conjugating enzyme E2 (UniProt ID: Q712K3), (b1) crystal structure of E2 enzyme having residues 1–202 (PDB ID: 6NYO). (c) E3 ubiquitin ligase (UniProt ID: Q9UNE7), (c1) crystal structure of E3 ubiquitin ligase (PDB ID: 4KBQ). In Plots (a–c), the outputs of PONDR® VSL2, PONDR® VL3, PONDR® VLXT, PONDR® FIT, and IUPred are represented by black, orange, blue, yellow, and purple lines, respectively. Mean disorder profile, calculated by averaging the outputs of five predictor-specific per-residue disorder profiles, is depicted by olive color. Light-olive shadow around the mean curve represents the error distribution for the mean. The light-yellow shadow around the PONDR® FIT curve shows error distribution for PONDR® FIT. In (a1), crystal structure of the E1 enzyme (PDB ID: 6DC6) is represented in faded blue color, disordered residues are shown in salmon pink color, and MoRF residues identified by MoRFCHiBi_Web server (1048–1057) are shown in grey color. In (b1), E2 enzyme (1–202 length with missing residues 1–5 and 193–202 at N- and C-terminal, respectively) is shown with Ubiquitin-60S ribosomal protein L40 (RPL40A; orange color). In (c1), Hsc70 Lid-Tail domains (orange color) in complex with E3 ubiquitin ligase (which is represented in faded blue color); disordered residues in E3 are shown in salmon pink color. In (a2,b2,c2), functional disorder profiles, MoRFs, and PTMs in E1, E2, and E3 enzymes using D2P2 server have been shown.

