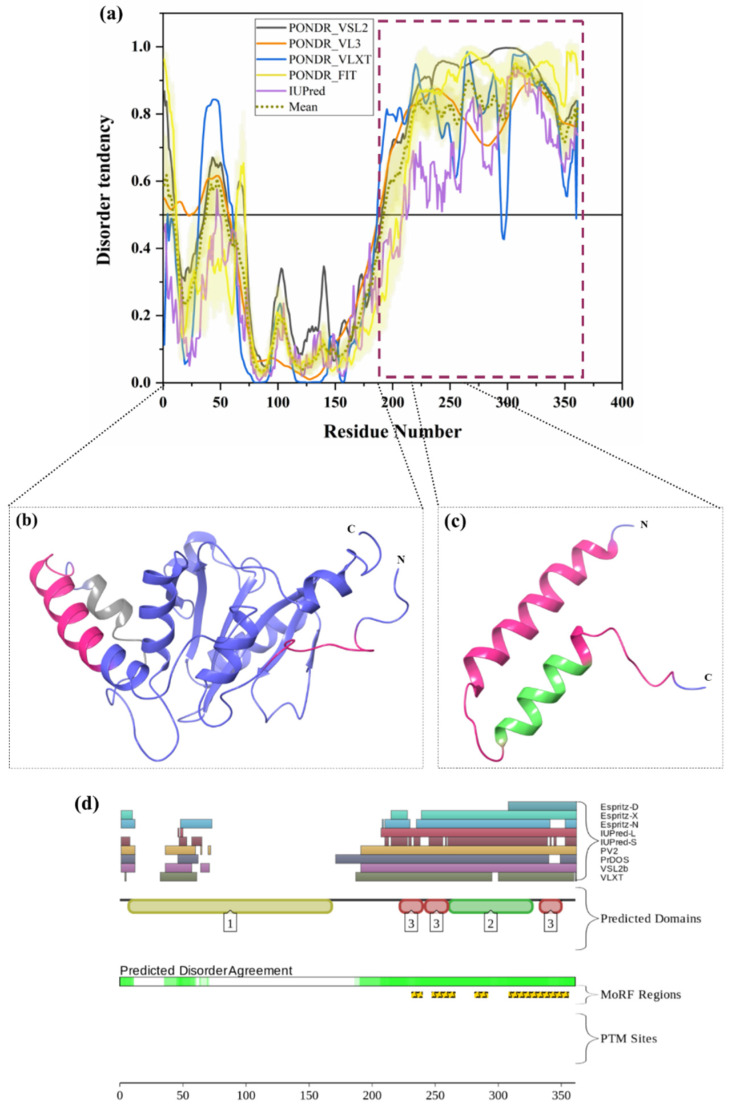
Figure 9.
Intrinsic disorder predisposition of ataxin-3. (a) Intrinsic disorder profile generated for ataxin-3 (UniProt ID: P54252) by a set of per-residue disorder predictors, such as PONDR® VSL2, PONDR® VL3, PONDR® VLXT, PONDR® FIT, and IUPred. (b) Crystal structure of the Josephin domain of ataxin-3 (PDB ID: 2AGA). (c) NMR solution structure of the tandem UIM domain of ataxin-3 (PDB ID: 2KLZ). In Plot (a), disorder profiles generated by set of disorder predictors, such as PONDR® VSL2, PONDR® VL3, PONDR® VLXT, PONDR® FIT, and IUPred, are depicted by black, orange, blue, yellow, and purple curves respectively. A mean disorder profile calculated from average of five predictor-specific per-residue disorder profile is shown by the olive color curve. Predicted disorder scores above 0.5 are considered as disordered residues/regions. The light-olive shadow around the mean curve represents the error distribution for the mean. The light-yellow shadow around the PONDR® FIT curve shows the error distribution for PONDR® FIT. In Plots (b) and (c), ataxin-3 is represented by a faded blue color; disordered residues are shown by a salmon pink color. In (b), the position of MoRFs (residues 56–65) predicted by the MoRFCHiBi_web server is shown by a gray color (PDB ID: 2AGA). In (c), the position of MoRFs (residues 246–255) predicted by the MoRFCHiBi_Web server is represented as MoRFs lying in IDPRs by faded green color (PDB ID:2KLZ). (d) The D2P2 server-based functional disorder profile is shown.

