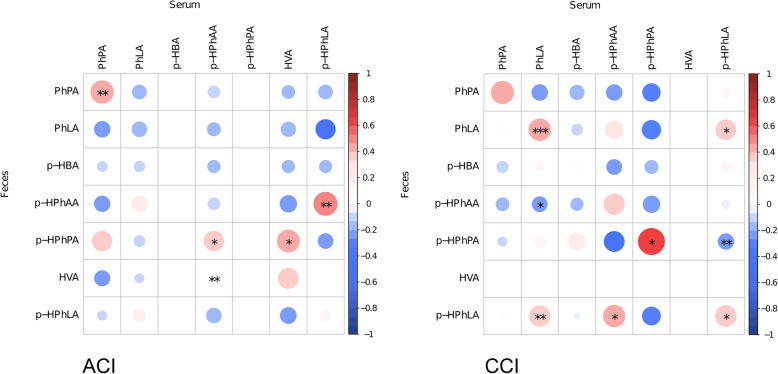
Fig. 5.
Correlations between aromatic metabolite levels in feces and serum. The size of circles denotes the absolute value of the Pearson correlation coefficient between metabolite levels; blue colors show negative and red positive correlations. Asterisks denote significant associations (***raw p < 0.01, **raw p < 0.05) and trends (*raw p < 0.1). PhPA phenylpropionic acid, PhLA phenyllactic acid, p-HBA p-hydroxybenzoic acid, p-HPhAA p-hydroxyphenylacetic acid, p-HPhPA p-hydroxyphenylpropionic acid, HVA homovanillic acid, p-HPhLA p-hydroxyphenyllactic acid

