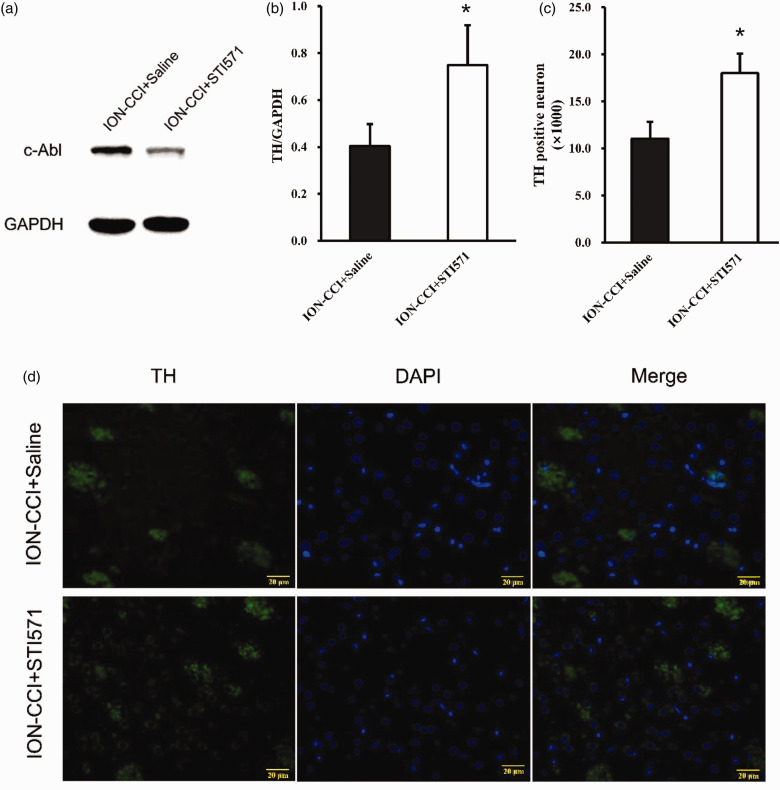
Figure 6.
(a) On the 14th day after surgery, the expression of TH in the right striatum of the ION-CCI+Saline and ION-CCI+STI571 group rats was detected by Western blotting, (b) Western blot results of TH in IONCCI+Saline and ION-CCI+STI571 group based on quantification using Image J software, showed as Mean ± SEM (ANOVA, *P < 0.05 indicates comparison with ION-CCI+Saline), (c) TH-positive neurons in IONCCI+Saline group and ION-CCI+STI571 group based on quantification using ImageJ software, data are shown as Mean ± SEM (ANOVA, *P < 0.05 indicates comparison with ION-CCI+Saline), (d) TH expression in ION-CCI+Saline and ION-CCI+STI571 group (the green fluorescence represents the TH, and the blue fluorescence represents DAPI, 400×).

