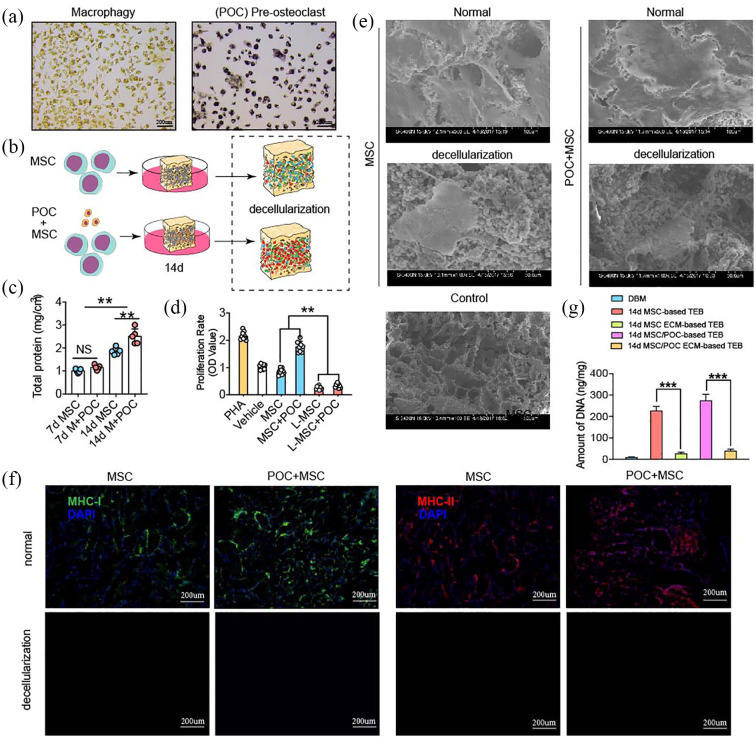
Figure 1.
Fabrication and characterization of MSC/POC ECM-based TEBs. (a) Pre-osteoclasts (POCs) presented TRAP-positive staining. Scale bars: 200 μm. (b) Schematic illustration of ECM-based TEB fabrication. (c) Quantitative analysis of the total proteins retained on ECM-based TEBs. (d) Biocompatibility analysis of ECM-based TEBs using a mixed lymphocyte reaction (MLR) assay. (e) Surface morphology of ECM-based TEBs under scanning electron microscopy (SEM). Scale bars are 100 μm and 50 μm. (f) Fluorescence staining of DAPI as well as MHC-I and MHC-II. Scale bars: 200 μm. **p < 0.01, *p < 0.05, NS: no significance. (g) Quantification of DNA before and after lyophilization. DNA was nearly completely removed, ***p < 0.001.

