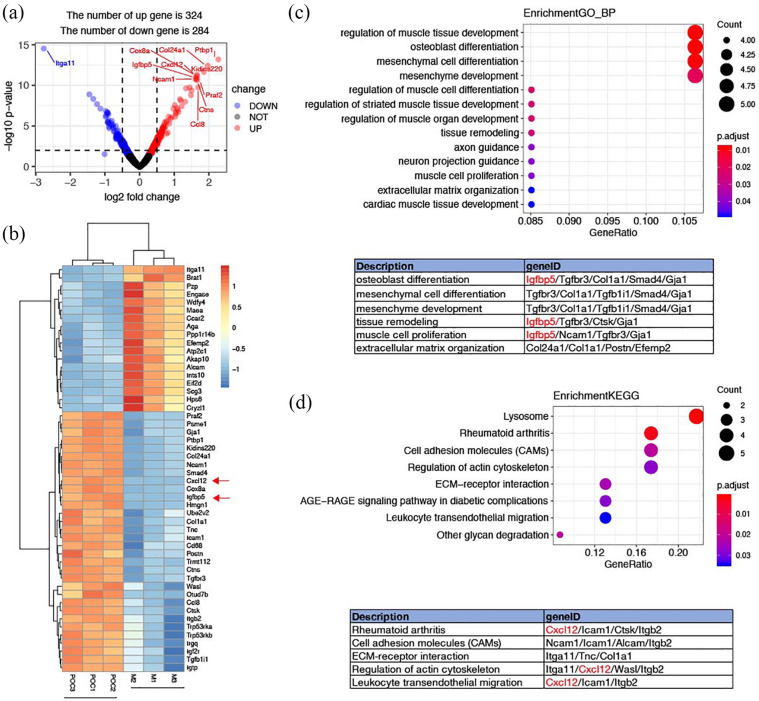
Figure 4.
Proteomic analysis of ECM-based TEBs. (a) Volcano plot for the differential proteins profile. (b) Heatmap of the top 50 differentially expressed proteins. (c) Gene Ontology (GO) enrichment of the 608 differentially expressed proteins. (d) KEGG enrichment of the 608 differentially expressed proteins.

