Figure 3.
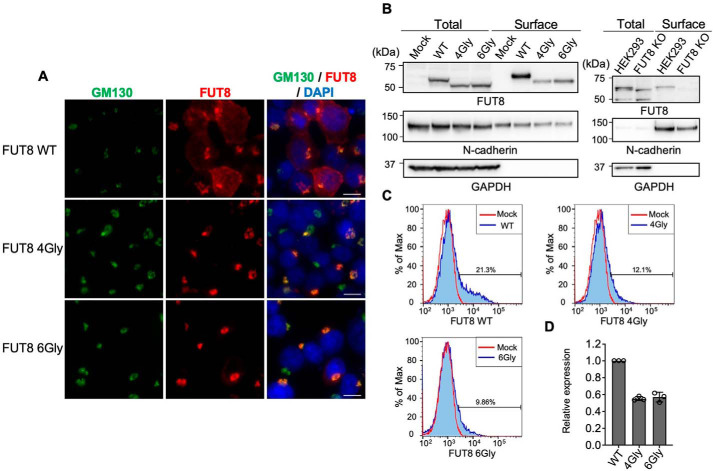
Subcellular localization of FUT8 WT and ΔSH3. A, HEK293 FUT8KO cells transfected with the plasmids for FUT8 WT or ΔSH3 were stained with anti-GM130 (green) and anti-FUT8 (sheep Ab) (red) antibodies and DAPI (blue). Scale bar, 10 μm. B, cell-surface proteins were biotinylated, and the biotinylated proteins were purified from cell lysates by streptavidin-conjugated beads and analyzed by Western blotting with anti-FUT8 (sheep Ab (left) and mouse Ab (right)) and anti-N-cadherin Abs. Left, HEK293 FUT8KO transfectants; right, untransfected HEK293 WT and FUT8KO cells. C, surface proteins of HEK293 FUT8KO cells expressing FUT8 WT or ΔSH3 were stained with anti-FUT8 sheep antibody and analyzed by FACS. Red line, mock-transfected cells; blue line, FUT8 WT- or ΔSH3-expressing cells. Bars, percentage of FUT8-positive cells. D, expression levels of the cell-surface FUT8 relative to that of the FUT8 WT in FACS analysis. The graph shows the mean ± S.D. (error bars) (n = 3).

