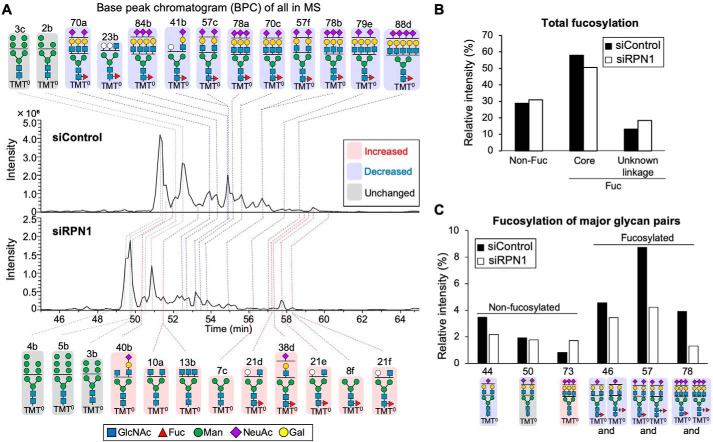
Figure 6.
LC-MS analysis of N-glycans in HEK293 cells treated with siRPN1. A, base peak chromatogram (BPC) from the LC-ESI MS analysis of N-glycans from HEK293 WT cells treated with siControl or siRPN1. N-Glycans were labeled with aminoxy tandem mass tag 0 (aminoxyTMT0). The deduced structures of the major N-glycans are shown. Pink, glycans increased in siRPN1; blue, glycans decreased in siRPN1; gray, glycans unchanged between the siControl and siRPN1. B, sum of the signal intensities of nonfucosylated, core-fucosylated glycans, and fucosylated glycans with unknown linkage from LC-MS analysis. C, LC-MS signal intensities of major pairs of core-fucosylated and nonfucosylated N-glycans derived from siControl- and siRPN1-treated cells.

